
2026#02: Humpty Dumpty’s Great Fall: The Bull Trap that Scrambled the Market
FII outflows and Trump's tariff threats trigger the sharpest market drawdown in months.

The Indian equity market ended the week on a weak note, with headline indices snapping their early-year record run and broader markets seeing the sharpest drawdown in over three months as profit‑taking, risk‑off global cues and persistent FII selling weighed on sentiment.
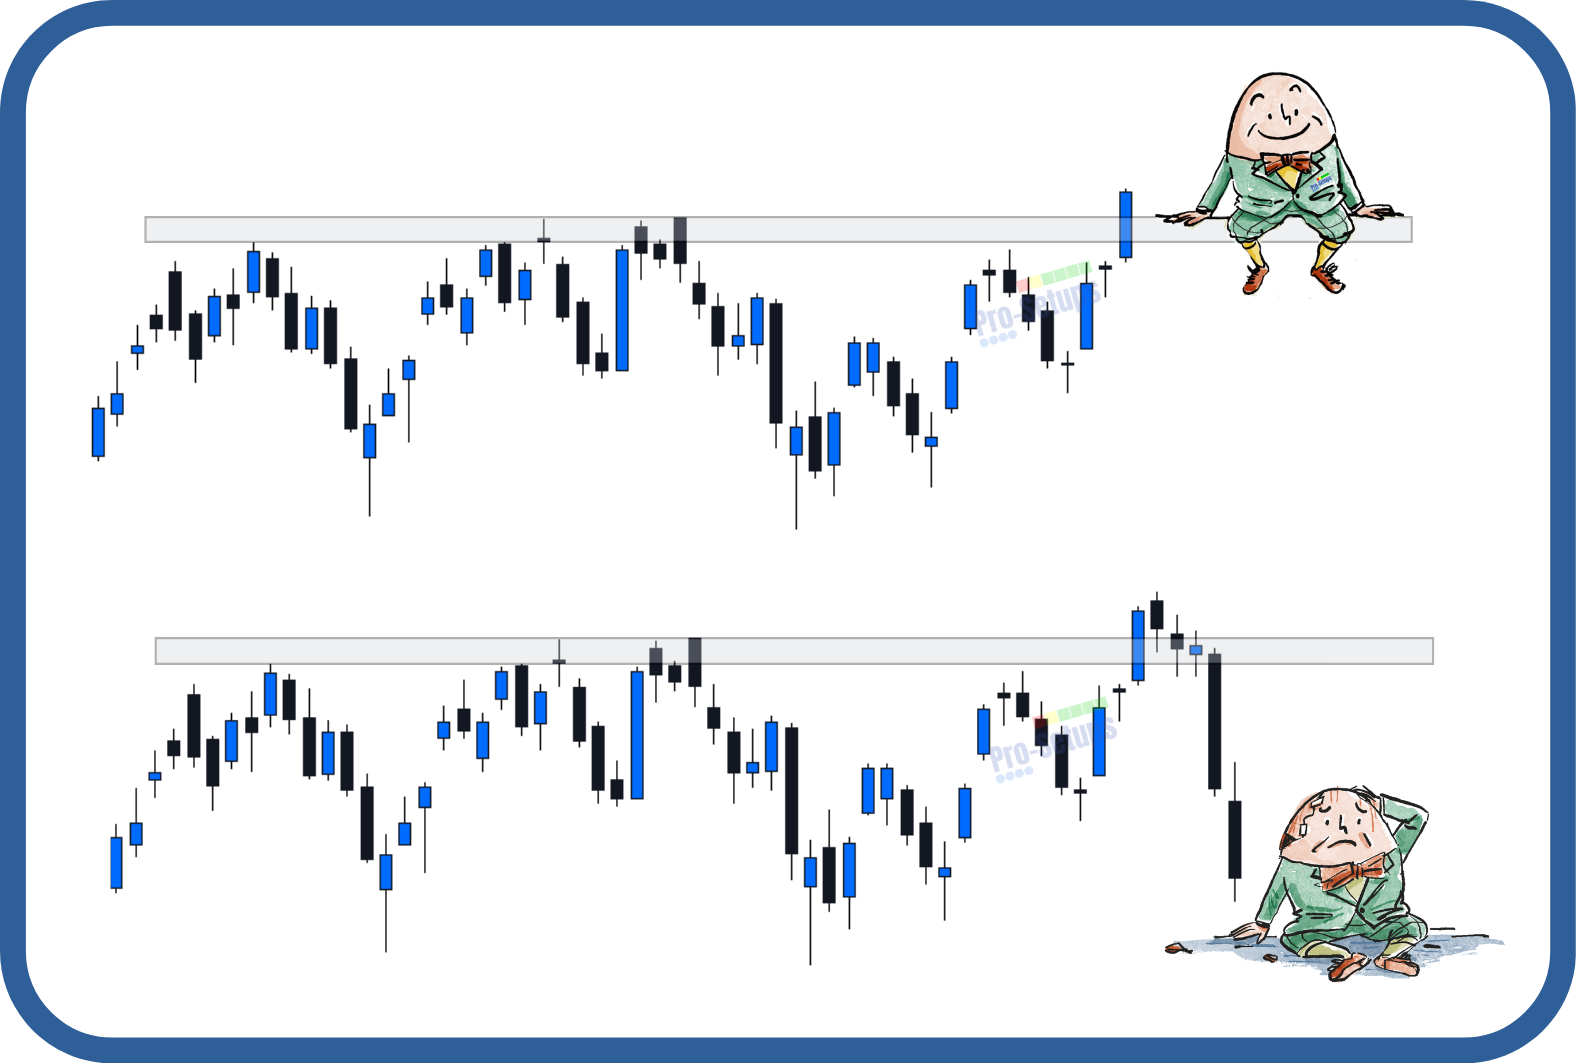
The “Wall” on which our dear Humpty Dumpty was sitting represented a strong resistance zone (around the 24,000-24,100 level for Nifty500) that the market had tested multiple times. By the end of last week and the very start of the New Year, the index finally pushed above this resistance.
This week, the market experienced a “Great Fall,” losing over ₹15 lakh crore in investor wealth. The index didn’t just slide; it crashed significantly lower. The last week’s breakout proved to be a ‘Bull Trap’.
Key Indices Performance:
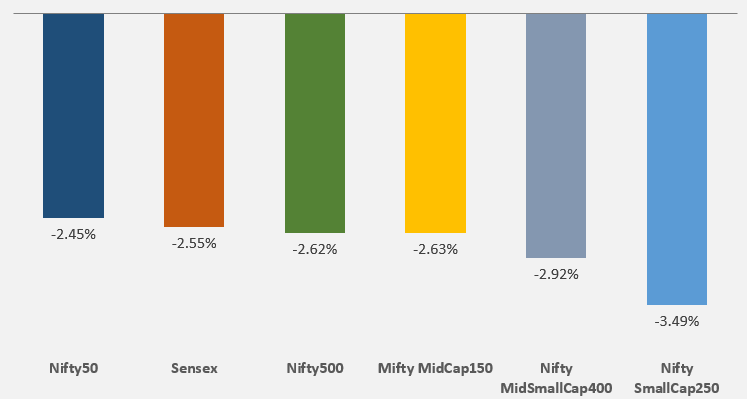
The Nifty50 and Sensex each fell roughly 2.5% for the week ending January 9, 2026, but the real ‘scramble’ occurred in the more volatile segments; the Nifty SmallCap 250 took the hardest hit, plunging -3.49%.
Key Drivers for the Market
Worst week in months: Aggregate market capitalization eroded by roughly ₹15 lakh crore, marking the steepest weekly wealth destruction since around September 2025. Last week euphoria turned into profit booking this week.
The “Trump Tariff” Shock: US President Donald Trump sharply escalated his tariff stance against India by backing the ‘Sanctioning Russia Act of 2025’. The Act authorizes punitive duties of up to 500% on all goods and services imported from countries that continue to buy Russian oil, with India explicitly named among the targets.
FII Selling: Foreign Institutional Investors continued their aggressive selling streak.
Ongoing Earnings season: The results season has now started, and more quarterly numbers will keep coming over the next few weeks. Corporate India’s performance will be the ultimate test for the market mood going forward.
Pre-Budget 2026 Positioning: With the Union Budget usually presented on February 1, January is the peak month for ‘Budget trades’.
Technical Perspective
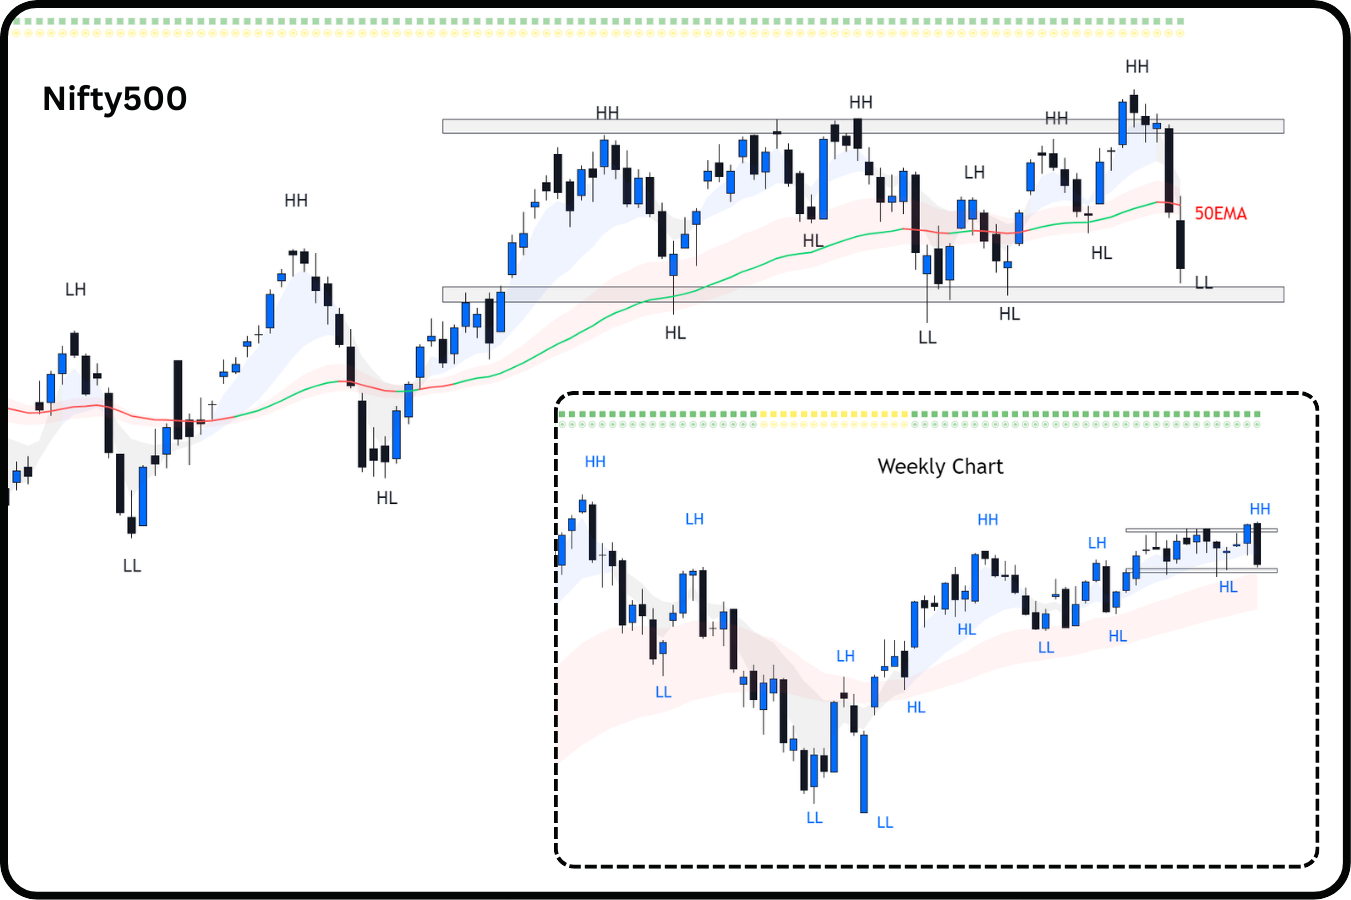
Nifty500 failed to sustain its recent breakout and entered a significant corrective phase. The failed breakout followed by a deep ‘V-shaped’ decline has altered the short-term market structure. The index is back into the consolidation phase now.
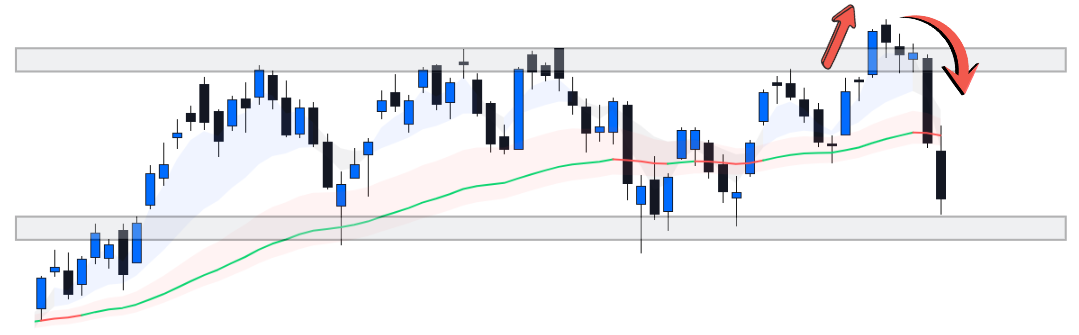
The most recent price action has established a clear Lower Low (LL), signaling a shift from a ‘buy on dips’ environment.
Weekly Perspective: The weekly chart shows that the broader bullish trend is being severely tested. This week’s candle shows a significant bearish engulfing-style movement that has erased last few weeks of gains. The index is currently resting near the Lower Low (LL) support zone established in December.
50EMA: The index could not sustain above its rising 50EMA this week and fell back in the consolidation range. Reclaiming and sustaining levels above the 50EMA is crucial to neutralize recent bearish momentum and restore investor sentiment.
The reason we track Nifty500 is because it represents over 90% of the free float market capitalization, making it a comprehensive barometer of market health.
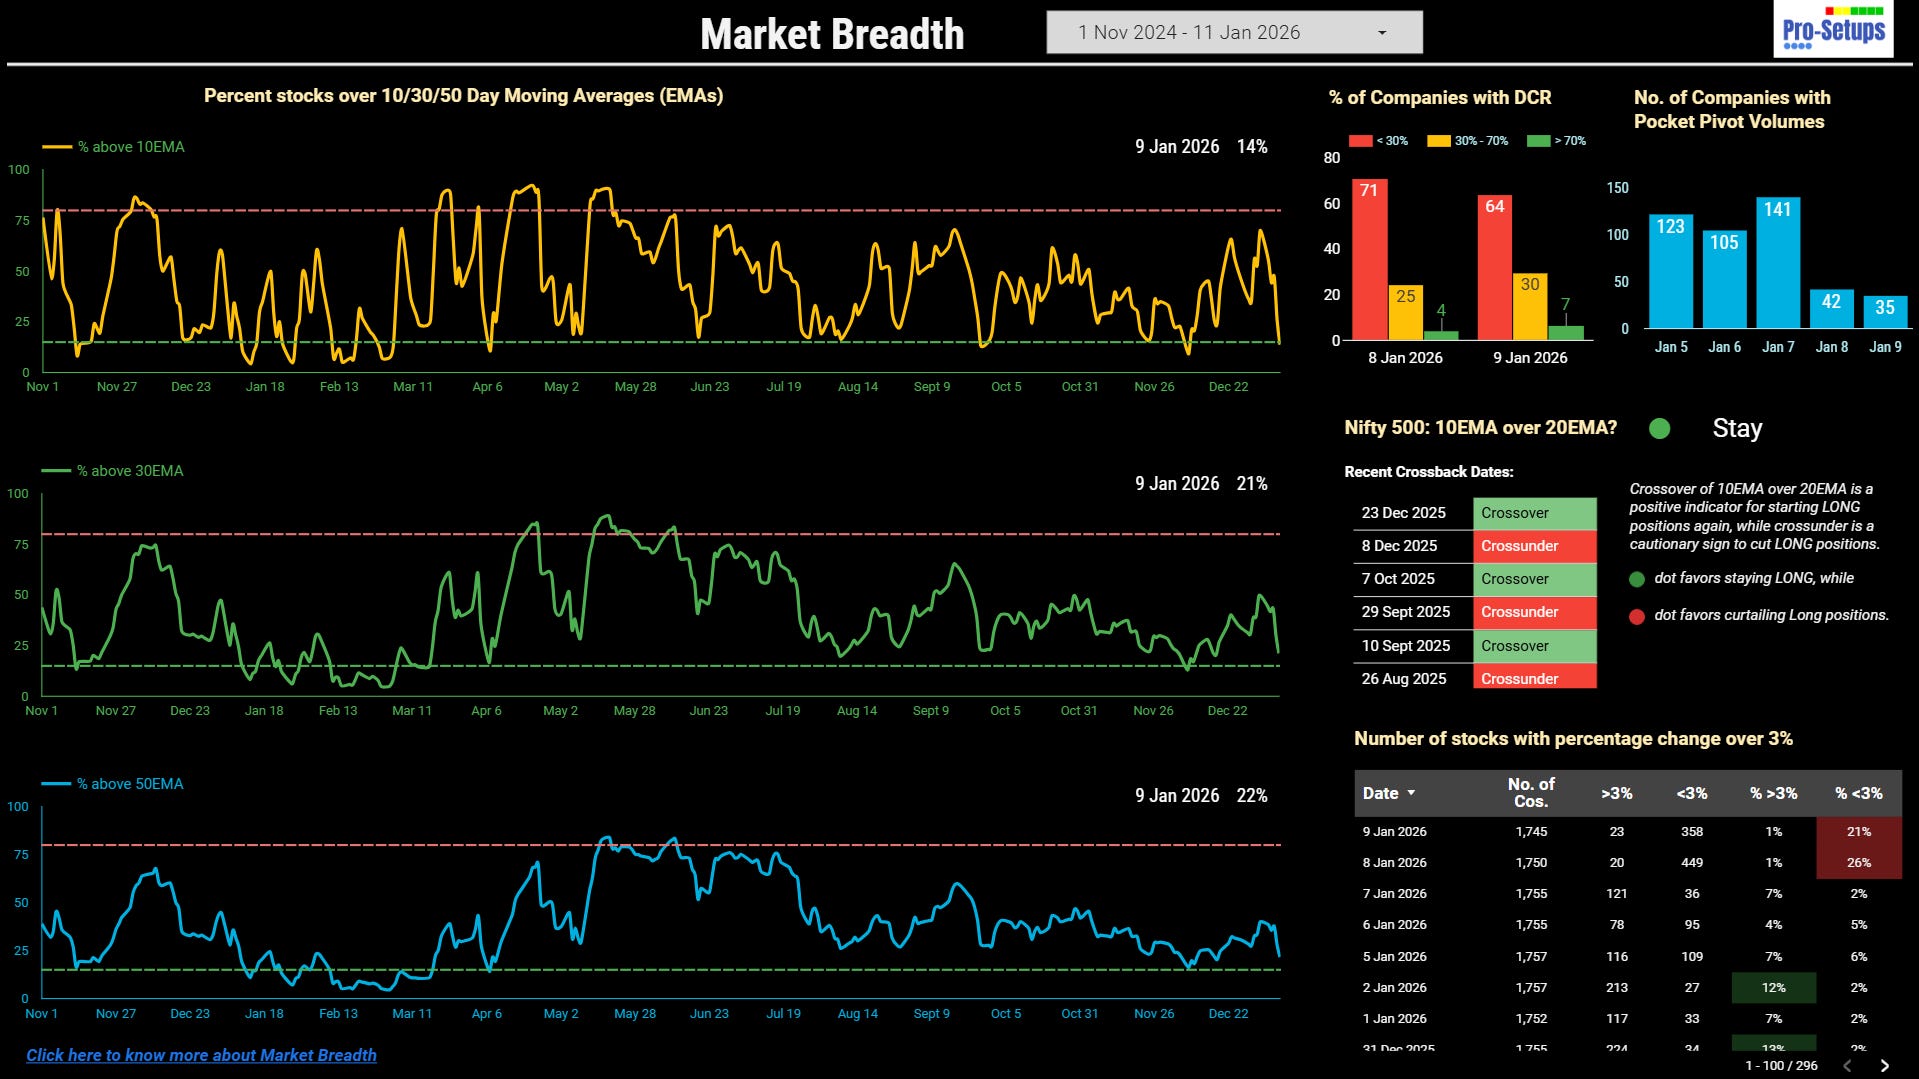
Nifty500’s 10EMA crossed over its 20EMA on 23rd December triggering a ‘Stay’ signal that suggests holding onto existing long positions. This edge is now very slim, and even a sideways move from here could cause the 10EMA to cross under 20EMA next week.
The significant gains in breadth seen last week have been largely erased, with all indicators crashing well below the 50% midpoint.
10-Day EMA: 14% of stocks are now trading above their 10EMA, a substantial fall from 70% last week.
30-Day EMA: 21% of stocks are above their 30EMA, compared to 50% last week.
50-Day EMA: 22% of stocks are above their 50EMA, compared to 40% last week.
Short-term collapse: The percentage of stocks above their 10EMA plummeted from 70% to 14%, indicating a violent short-term sell-off across the broader market.
Medium-term weakness: Readings for the 30EMA (21%) and 50EMA (22%) show that structural support has failed to hold, with roughly 80% of the market now trading in a downward medium-term trend.
It is important to note that overbought or oversold signals are most relevant for swing traders, as they reflect short-term momentum shifts.
Accessing Market Breadth on Pro-Setups Dashboard is available for all readers. Click on the link below.
Summary
This week, the Nifty 500 faced a sharp reversal, failing to sustain its recent breakout and transitioning from a recovery back into a corrective phase in a single week. This week’s fall was triggered by global headwinds, including FII outflows and escalating India-US trade tensions regarding potential tariffs. Consequently, market breadth has also deteriorated. The market has transitioned from a bullish breakout attempt to a test of its medium-term support levels. While the 10/20 EMA crossover signal has not yet flipped to ‘Crossunder’ (which will happen most likely in the coming week), the market breadth is extremely poor. With only 14-22% of stocks trading above their moving averages, the current environment suggests extreme caution and capital preservation.