
2026#05: Nifty500 Navigates Pre-Budget Volatility
Broader markets stage an oversold relief rally, yet a structural "Sell on Rallies" regime persists. All eyes now turn to the Union Budget 2026.

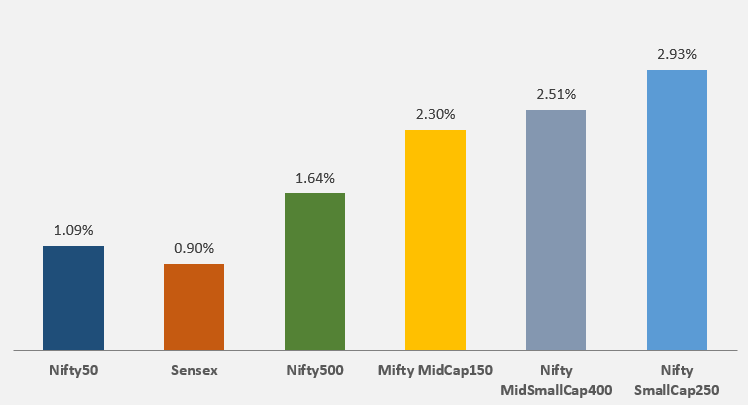
Indian equities ended the week on a positive note with benchmark indices gaining around 1%, while broader Midcap & Smallcap indices gained over 2%, recovering from a deep correction earlier in the month, but ultimately ending on a cautious note as investors preferred to move to the sidelines ahead of the Union Budget 2026.
Key Indices Performance:
Key Drivers for the Market
FII Selling & Rupee Weakness: FIIs remained aggressive net sellers throughout January. This pressure was compounded by the Indian Rupee hitting a record low of near ₹92 per dollar, pressured by global ‘risk-off’ sentiment among international investors.
Pre-Budget Nervousness: With the Union Budget scheduled for Sunday, February 1, there was some profit-taking as traders cut leverage and reduced risk heading into the event. Markets will react to announcements regarding capital gains tax, infrastructure spending, Defence, green energy, and AI sectors.
Geopolitical and Trade Tensions: Rising global uncertainties, including US trade tariff threats continue to remain the a major event risk going further.
Q3 Earnings Season: The Q3 of FY26 earnings season is in full swing. The final leg of the earnings season will continue to drive stock-specific movements.
Valuation Matters
This week, we introduced ‘Valuation Grade’ filter in our Pro-Setups Dashboard. While technical analysis focuses on price and charts, adding valuation during a market correction becomes important even for swing and positional traders. When markets fall sharply, prices drop faster than businesses weaken. Reasonably valued stocks attract long-term investors which later fuels strong trends.
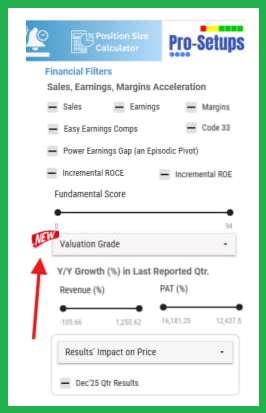
Without valuation as a filter, it becomes difficult to decide which breakouts deserve capital. Stocks with attractive valuation, good ROE and growth have a much higher probability of converting a bounce into a sustainable uptrend.
Each stock is graded from A+ to E, where A+ represents the most attractive valuation and E the least attractive.
The grades are not based only on low valuation multiples. They also take into account the quality (ROE) and growth of a company and compares it with other stocks in the same sector.
So while this filter is not a buy signal, it highlights stocks that are relatively attractive on valuation. That said, valuation is not an exact science. It is more of an art. Our assessment can be wrong. But the grading system helps us focus our attention on better candidates.
Technical Perspective
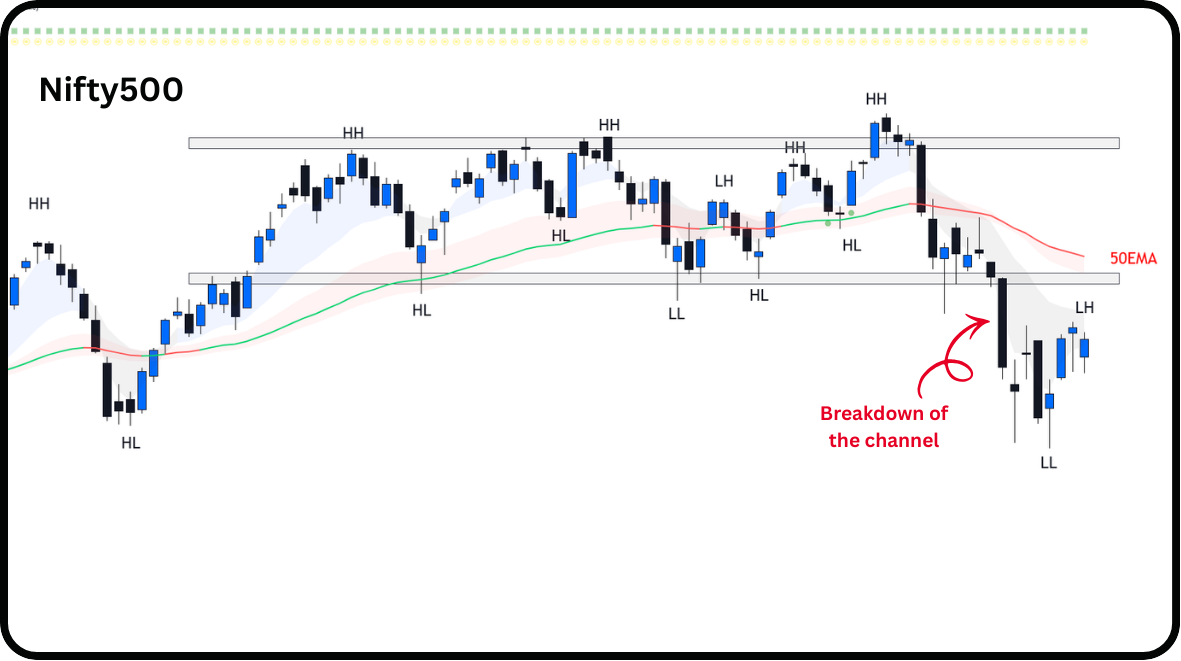
Nifty500 concluded a highly volatile month, characterized by a failed bullish breakout followed by a sharp structural breakdown.
Channel Breach: The index has decisively breached the lower support boundary (approx. 23,400) of the recent consolidation zone, that had acted as a support floor since December.
Lower Low (LL) Formation: After hitting a fresh 52-week high of 24,144 early in the month, the index failed to sustain those levels, subsequently plunging to form a series of Lower Highs and a Lower Low near 22,562.
50EMA: The 50EMA is now in declining state and has thus turned red, acting as a stiff overhead resistance level. The price is now trading significantly below 50EMA, signaling a loss of short-to-medium-term momentum.
The reason we track Nifty500 is because it represents over 90% of the free float market capitalization, making it a comprehensive barometer of market health.
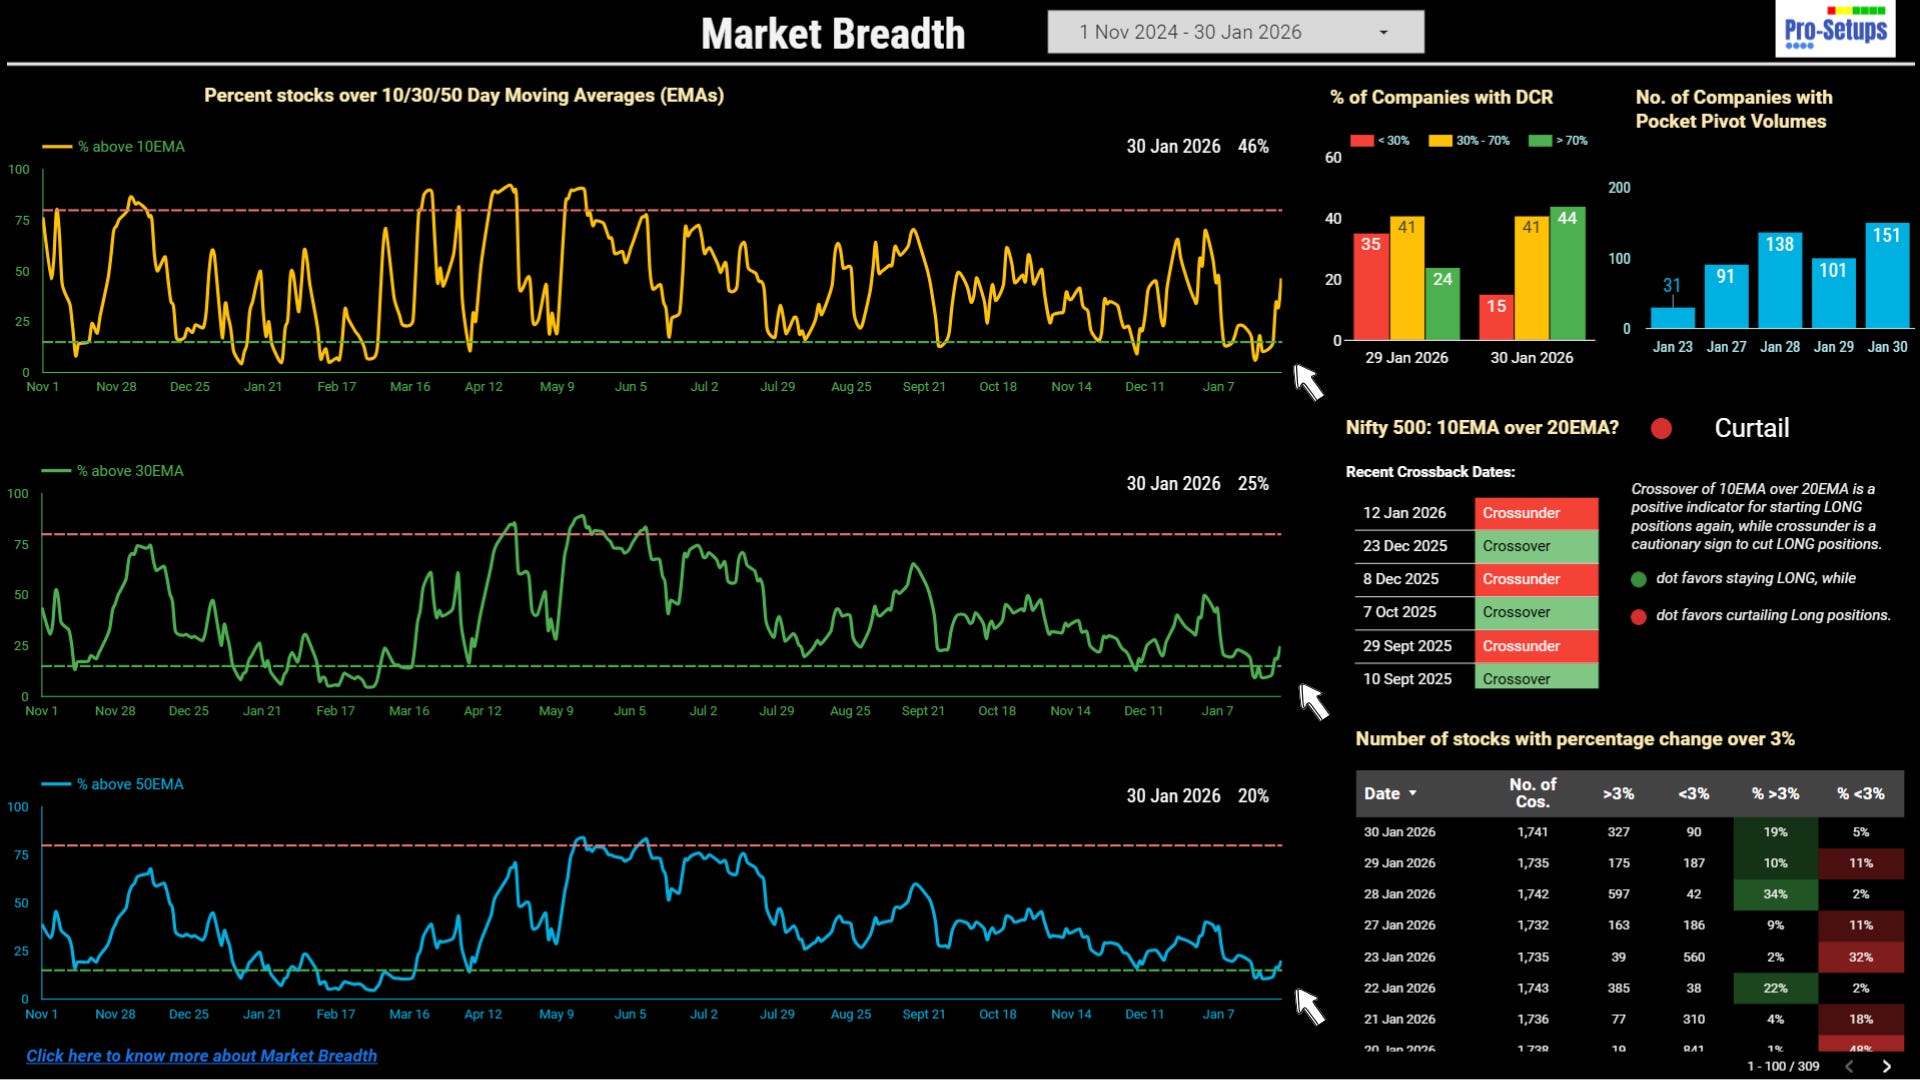
Nifty500’s 10EMA crossed under its 20EMA on 12th January triggering a ‘Curtailing’ signal that suggests reduction or closure of existing long positions.
The market breadth shows signs of a technical recovery from extreme oversold levels, though the structural trend remains in a defensive state. While momentum has improved, the short-to-medium-term structural trend is not yet fully bullish.
There has been a significant bounce in short-term participation, but medium-term levels continue to lag behind the healthy 50% threshold:
10-Day EMA: 46% of stocks are now trading above their 10EMA, compared to 11% last week. The jump from 11% to 46% in stocks above the 10EMA confirms the “oversold bounce” anticipated last week.
30-Day EMA: 25% of stocks are above their 30EMA, compared to 10% last week.
50-Day EMA: 20% of stocks are above their 50EMA, compared to 11% last week. The 50EMA reading is at just 20%, meaning 80% of the stocks are still in a medium-term downtrend despite the recent bounce.
The market has staged a strong relief rally after the extreme selling of the previous week. However, with the "Curtail" signal still active and the 50EMA breadth at just 20%, this move is currently a counter-trend bounce rather than a new uptrend.
It is important to note that overbought or oversold signals are most relevant for swing traders, as they reflect short-term momentum shifts.
Accessing Market Breadth on Pro-Setups Dashboard is available for all readers. Click on the link below.
Summary
The market has shifted into a "Sell on Rallies" mode, driven by heavy FII selling and global trade uncertainties, where any minor recovery is expected to be met with selling pressure. While domestic institutional investors continue to provide support, a decisive turnaround is dependent on the upcoming Union Budget 2026 and the remainder of the Q3 FY26 earnings season. Previous support levels now act as resistance. The technical setup suggests that the market will likely remain volatile and under pressure heading into the Union Budget 2026. Until these clear the air, the technical indicators point toward a volatile, "wait-and-watch" environment with a downward bias.