
2026#06: Repair Phase - Can the Trade Deal Fuel the Next Leg?
While the India-US trade deal sparked a recovery, the Nifty500 awaits a bullish EMA alignment for an uptrend directional movement.

The Indian stock market witnessed a historic and highly volatile week ending February 6, 2026, marked by extreme swings ranging from a budget day crash to a strong trade deal rally. The week began under heavy pressure following the February 1st (Sunday) budget session, where a hike in Securities Transaction Tax (STT) on derivatives triggered a sharp sell-off. However, sentiment pivoted dramatically on Tuesday after the announcement of the India-US trade deal, which slashed tariffs to 18% and fueled a strong single-day surge in the benchmark indices. The market eventually settled into a consolidation phase toward the end of the week, aided by a status-quo RBI policy that maintained the repo rate at 5.25% but upgraded GDP growth forecasts.
Key Indices Performance
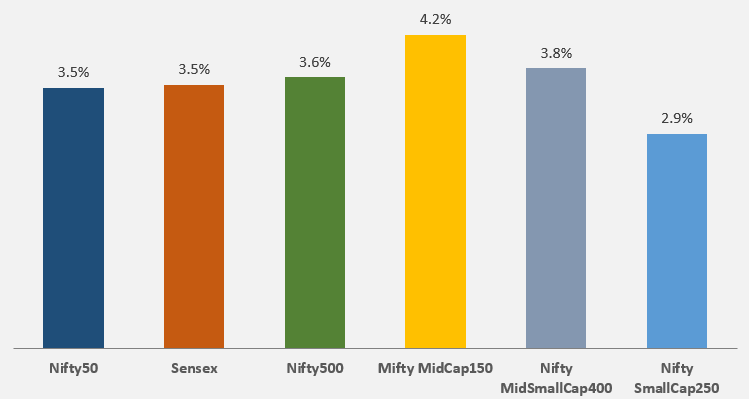
It was a week of broad-based recovery across the Indian markets, driven by the India-US trade deal.
Key Drivers for the Market
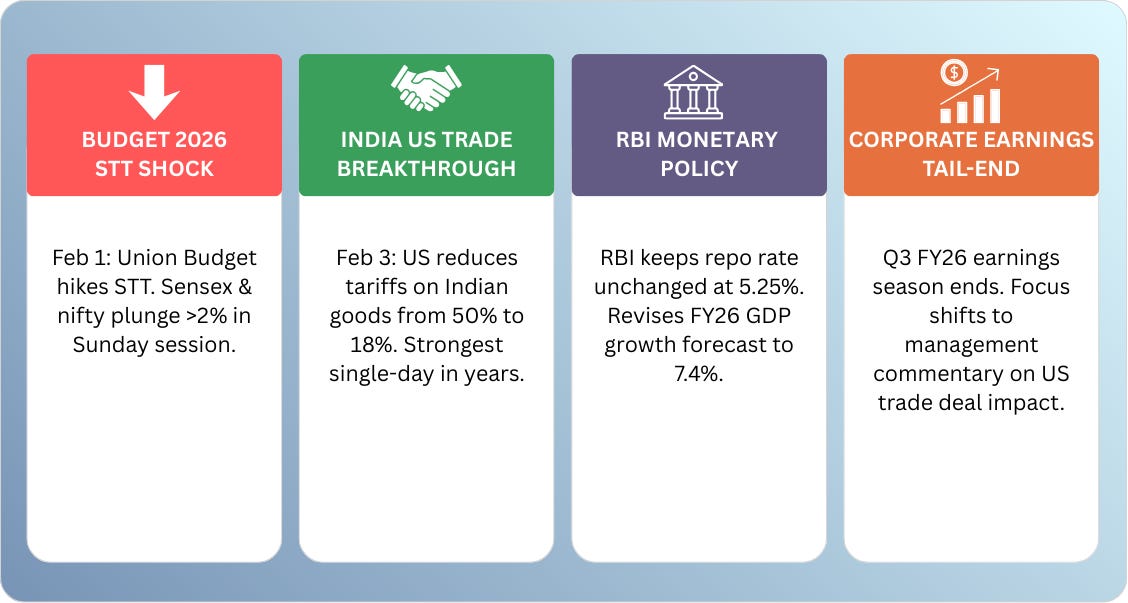
Budget 2026 STT Shock: The Union Budget 2026, presented on February 1, 2026, triggered a sharp market sell-off due to hike in STT, with key benchmark indices (Sensex and Nifty50)) both plunging over 2% during the Sunday trading session.
India-US Trade Breakthrough: However, the primary catalyst for the week’s recovery was the announcement that the US would reduce tariffs on Indian goods from 50% to 18%. This announcement provided one of the strongest single-day rally in years on 3rd Feb.
RBI Monetary Policy: The RBI kept the repo rate unchanged at 5.25% on Friday. While the status quo was expected, the upward revision of the FY26 GDP growth forecast to 7.4% (from 7.3%) reassured investors of the strength in Indian economy.
Corporate Earnings Tail-end: As the Q3 FY26 earnings season concludes this coming week, the focus will shift to management commentaries on how the the US trade deal will impact their bottom lines in the coming quarters.
AI Fears Trigger Global Tech Sell-off: Global and Indian IT stocks plunged this week as Anthropic’s new AI tools sparked fears of massive disruption to traditional enterprise software business models.
Technical Perspective
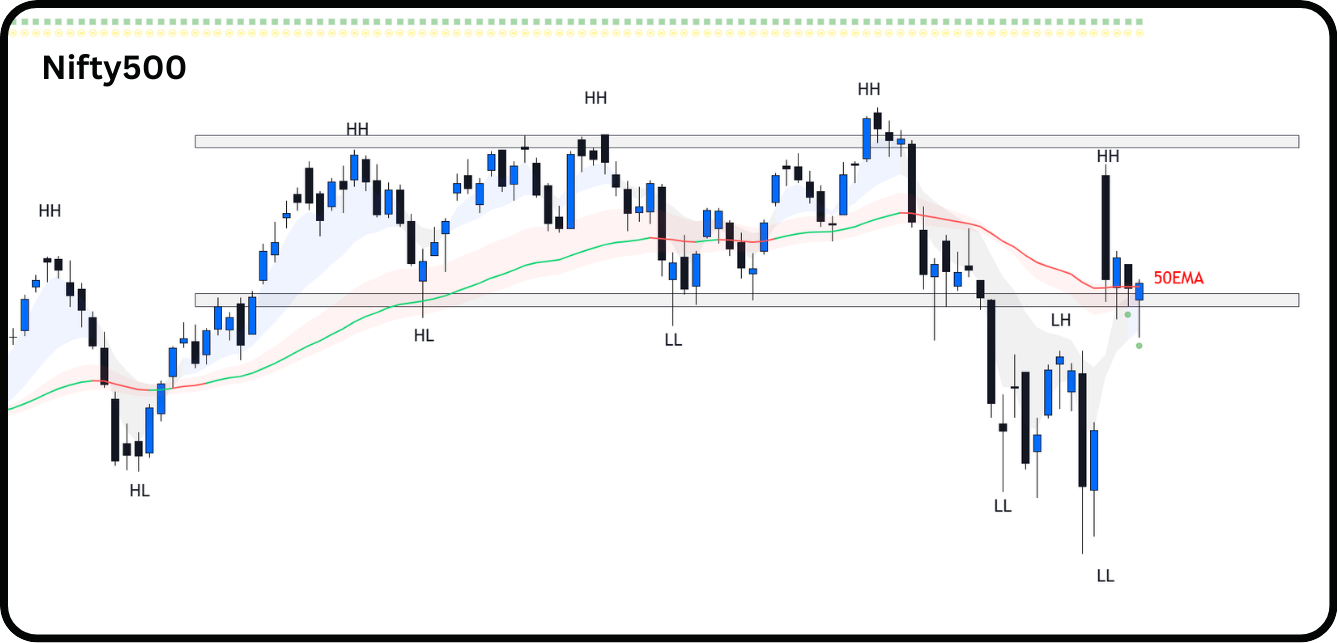
Nifty500 staged a significant tactical recovery after the extreme volatility triggered by the Union Budget on February 1. After the plunge established a new Lower Low (LL) on the budget day, the index found strong buying interest after the US-India trade deal announcement.
The index has transitioned from a sharp structural breakdown back into a repair phase, now trading near its 50EMA.
50EMA: The index must cross and sustain above 50EMA level to signal a true shift from a relief rally to a sustainable uptrend as the first sign of recovery.
Bullish Momentum Re-emerging: Both the 10EMA and 20EMA have started to curl upwards, reflecting the recovery seen over the last few sessions.
Bearish Alignment: Despite the upward turn of 10EMA & 20EMA, Nifty500 maintains a bearish alignment: 10EMA<20EMA<50EMA. The overall EMA structure suggests that the market is still in a "Sell on Rallies" regime until the 10EMA & 20EMA can decisively cross back above the 50EMA.
The reason we track Nifty500 is because it represents over 90% of the free float market capitalization, making it a comprehensive barometer of market health.
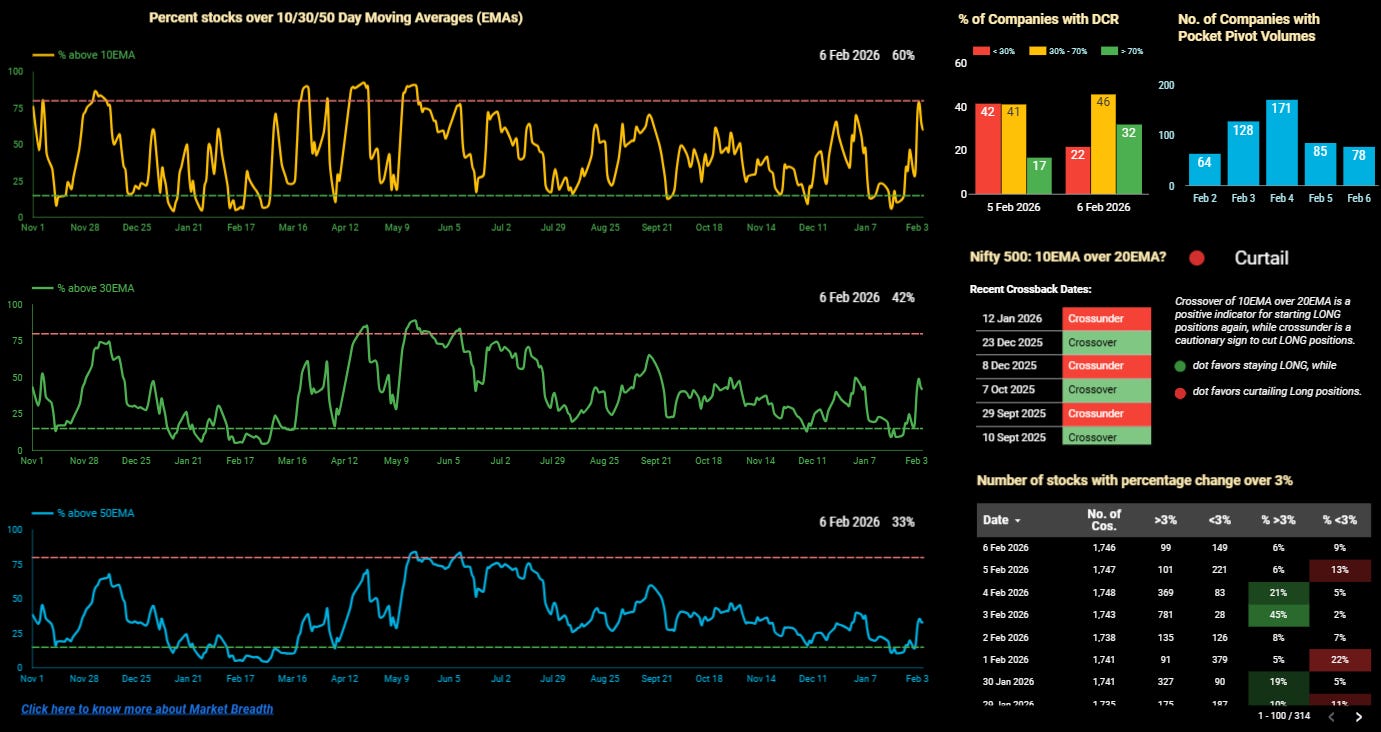
Nifty500’s 10EMA crossed under its 20EMA on 12th January triggering a ‘Curtailing’ signal that suggests reduction or closure of existing long positions.
The market witnessed a ‘V-shaped’ recovery in short-term participation from the oversold lows of late January, though structural repair at the medium-term level is moving slower.
All moving average breadth indicators shows improvement compared to the start of the week:
10EMA: Reclaiming 60% for the 10EMA is a positive milestone, indicating that more than half of the universe that we track are back in a short-term uptrend.
30EMA: 42% of stocks are above their 30EMA, compared to 25% last week.
50EMA: 33% of stocks are above their 50EMA, compared to 20% last week. While the recovery is broad, two-thirds of the market is still battling structural weakness. While momentum has improved, the medium-term structural trend is not yet fully bullish. A reading above 50% here is generally needed for a confirmed healthy market.
It is important to note that overbought or oversold signals are most relevant for swing traders, as they reflect short-term momentum shifts.
Accessing Market Breadth on Pro-Setups Dashboard is available for all readers. Click on the link below.
Summary
The Indian market has shifted from a downward bias into a period of high-volatility transition, where it is difficult to confidently label the current environment as ‘Sell on Rallies’ or ‘Buy on Dips’. While the market staged a strong recovery this week, the price action remains erratic. A true, sustainable ‘Buy’ environment will only be confirmed once the technical setup stabilizes and the EMAs achieve a bullish alignment, with the 10EMA>20EMA>50EMA on the Nifty500 chart. Until then, the market is likely to remain in a choppy, news-driven consolidation phase.