
2026#07: IT Meltdown Reverses Early Gains as Nifty500 Tests Key Support
While small-caps showed resilience, a sharp contraction in market breadth heightened caution for the week ahead.

The Indian equity markets faced a volatile and ultimately bearish week, characterized by a major sell-off on Friday that wiped out early gains. While the week started with a positive bias, the sentiment soured significantly due to global concerns regarding AI-led disruptions and brutal sell-off in IT stocks.
Key Indices Performance
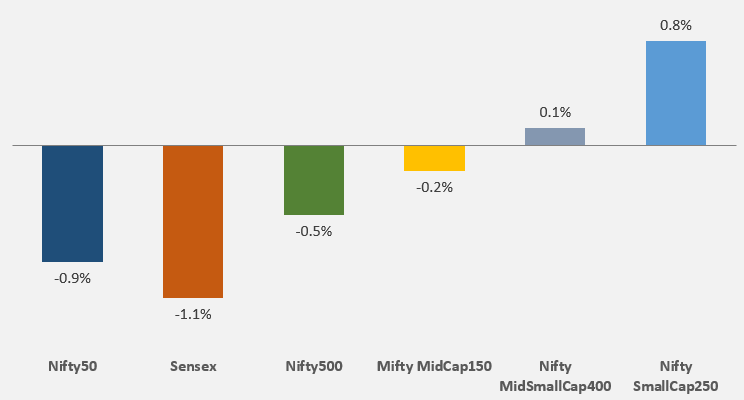
While selling pressure was concentrated in heavyweights and blue-chip stocks, mid & small cap segments showed some resilience.
Key Drivers for the Market
Sharp sell-off in IT stocks: Nifty IT index tumbled over 8% during the week, with large names like TCS, Infosys and Wipro hitting fresh 52week lows amid concerns on AI-led disruption to traditional service lines. As the AI disruption narrative remains a hot topic, Indian IT services companies will remain sensitive to global peers’ commentary.
Corporate Earnings Tail-end: As the Q3 FY26 earnings season concludes this coming week, the focus will shift to management commentaries on how the US trade deal will impact their bottom lines in the coming quarters.
Technical Perspective
Nifty500 dropped 1.43% on Friday alone, reflecting a broader market sell-off that has significantly weakened its short-term structure.
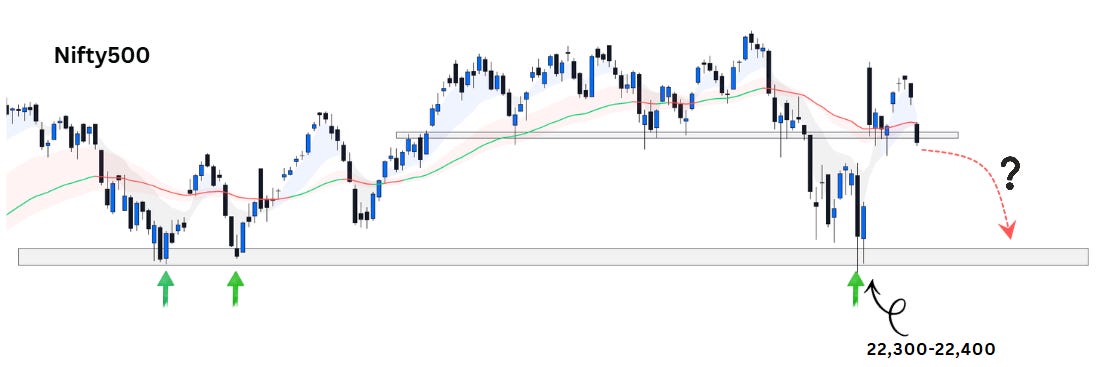
After a brief post-Budget recovery, the index failed to form a new Higher High and is instead drifting back toward its recent swing lows.
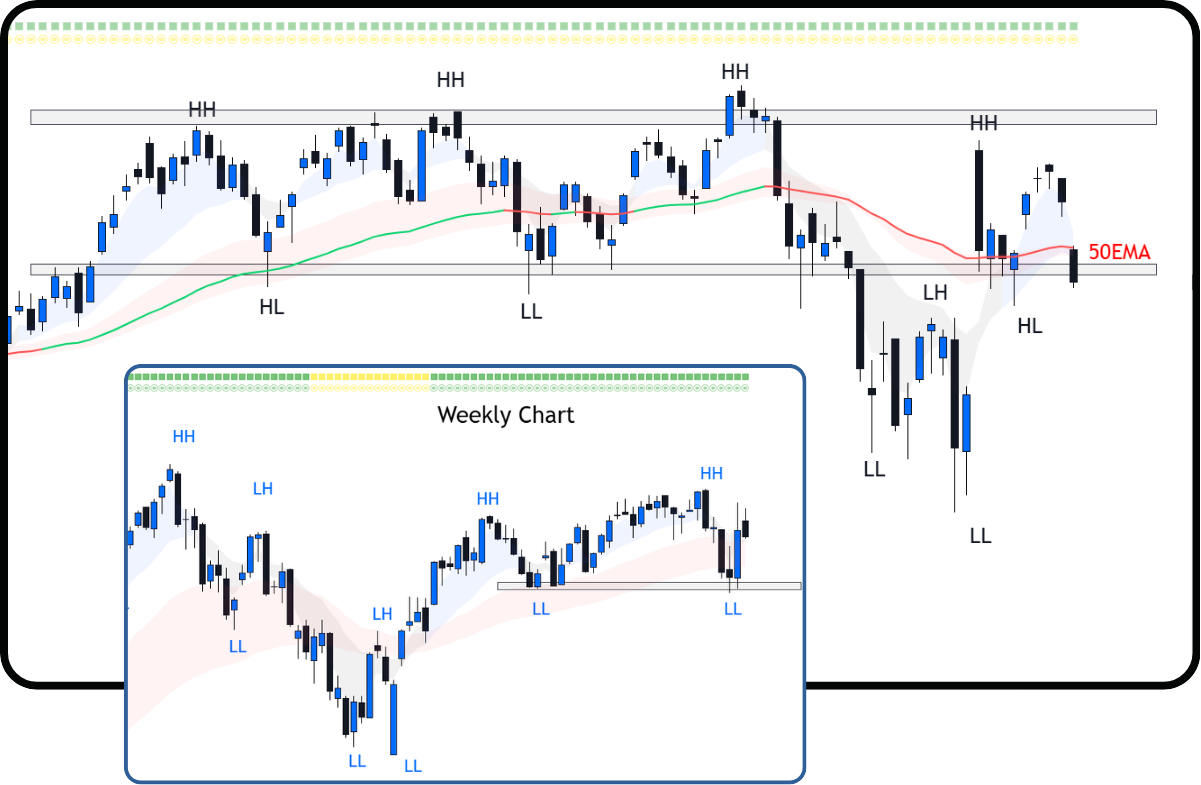
On weekly charts, Nifty 500 continues to trade within a long-term consolidation range.
50EMA: The index must cross and sustain above 50EMA level to signal a true shift from a relief rally to a sustainable uptrend as the first sign of recovery. On the contrary, it closed below 50EMA this week.
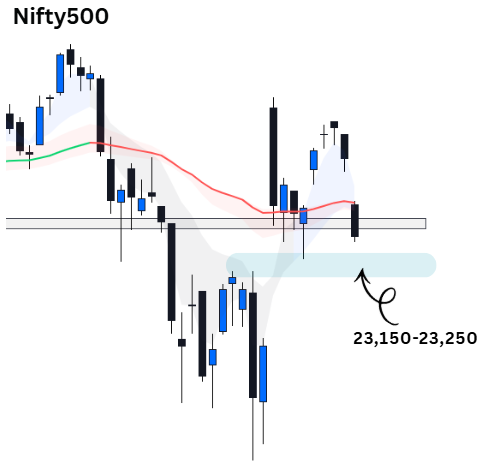
Critical Support Zone: The index is currently resting near the 23,150-23,250 demand zone (previous week’s swing low), which has repeatedly acted as support zone previously.
The February 1 post-Budget low (around 22,300-22,400 levels) - a breach here would be technically catastrophic.
Bullish Momentum weakened again: Nifty 500’s 10EMA briefly crossed back above the 20EMA, initially suggesting a spark of recovery. However, this momentum proved short-lived following Friday’s sharp rejection.
Bearish Alignment: Although the 10EMA technically moved above the 20EMA during the week, it has already curled downwards. 20EMA remains below downward sloping 50EMA.
The reason we track Nifty500 is because it represents over 90% of the free float market capitalization, making it a comprehensive barometer of market health.
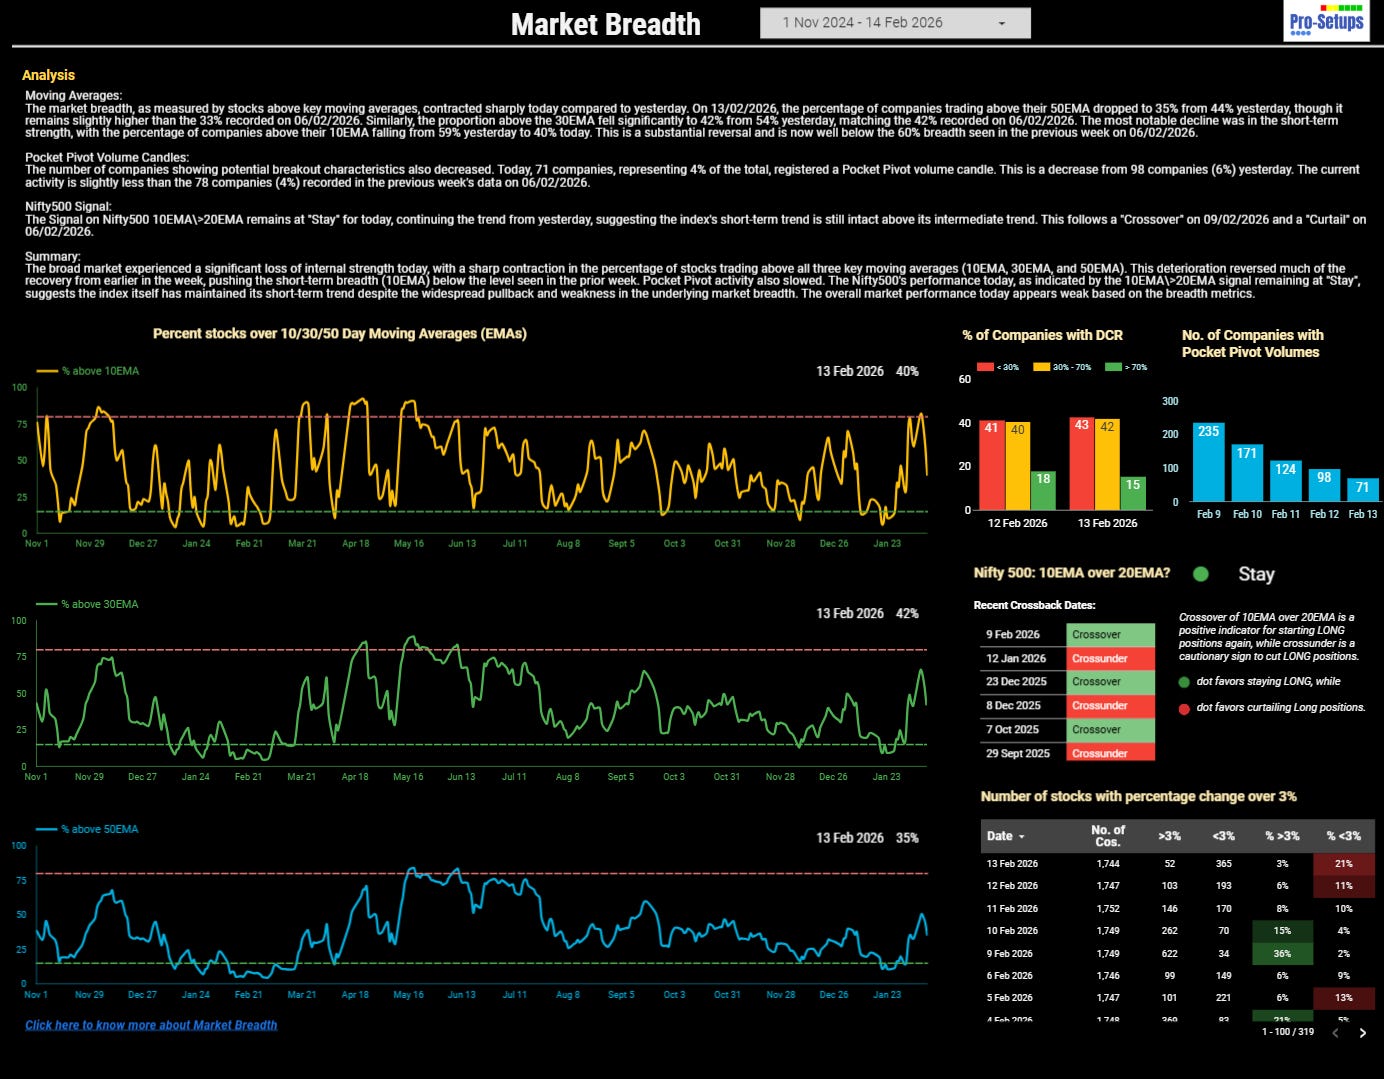
Nifty500’s 10EMA crossed above its 20EMA on 9th February triggering a ‘Stay’ signal that suggests maintaining long positions.
While the primary trend signal has turned bullish, the underlying participation has started to fracture following a surge early in the week. A further fall earlier next week and the ‘Stay’ signal will likely fail and turn into a ‘Crossunder‘.
Despite the ‘Stay’ signal, breadth indicators experienced a sharp contraction towards the end of the week, reversing much of the progress made earlier.
10EMA: 40% of stocks are now trading above their 10EMA, compared to healthy 60% last week.
30EMA: 42% of stocks are above their 30EMA, same as last week.
50EMA: 35% of stocks are above their 50EMA, compared to 33% last week. The 50EMA breadth has stalled around the same level 35%, failing to cross the critical 50% midpoint, which means that the broader market is still structurally weak.
It is important to note that overbought or oversold signals are most relevant for swing traders, as they reflect short-term momentum shifts.
Accessing Market Breadth on Pro-Setups Dashboard is available for all readers. Click on the link below.
Summary
Although the week started with a positive bias, sentiment was crushed by global concerns regarding AI-led disruptions, triggering a brutal sell-off in IT stocks. Heavyweights such as TCS, Infosys, and Wipro hit fresh 52-week lows. Consequently, the Nifty500 significantly weakened its short-term structure after failing to sustain above its 50EMA. While the Nifty 500’s 10EMA technically crossed above its 20EMA on February 9, a bearish alignment persists as the 20EMA remains below a downward-sloping 50EMA. A true, sustainable recovery will only be confirmed once the index decisively reclaims and sustains above the 50EMA, achieving a bullish alignment where the 10EMA>20EMA>50EMA. Until then, the market is likely to remain in a choppy, news-driven consolidation phase.