
2026#10: Geopolitics and FII Selling Shake Indian Markets
Market is in a technically weak zone. While oversold levels may offer a relief bounce, technical alignment remains firmly bearish.


The Indian stock market saw its worst weekly performance in more than a year, as rising geopolitical tensions and continuous selling by FIIs weakened overall market sentiment.
On Monday, the Nifty500 broke below its 200EMA with a gap down and that gap is now likely to act as a strong resistance. Rapidly evolving geopolitics and the relentless selling by FIIs is keeping the Indian market on the edge.
Key Indices Performance
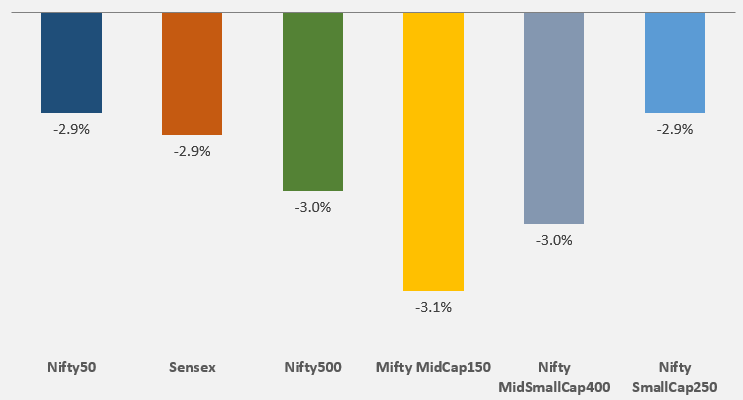
Every major market index recorded a decline of approximately 3% this week, highlighting a week of significant distress for the Indian equity markets. Every key index declined in varied degree thereby demonstrating a broad market wide secular bearish sentiment.
Key Drivers for the Market
Escalating West Asia Tensions: The primary catalyst for the market fall seems to be the rising conflict involving the U.S., Israel, and Iran and the real threat of this war expanding in the wider West Asian region. There are also concerns about possible disruption in the Strait of Hormuz, an important route for global oil supply, through which more than 20% of the global oil supply passes on a regular basis. This created a global ‘risk-off’ mood, where investors moved money out of stocks and into safer assets like gold. Brent crude prices also jumped above $90/barrel due to supply disruption fears. Rupee weakened to over ₹92/USD on crude surge.
The market’s near-term direction will depend mainly on whether the conflict escalates further or settles into a stalemate. Indian stock market will continue to face significant volatility. If the conflict deescalates quickly, recovery could be swift; otherwise, prolonged effects might push our market downward further.
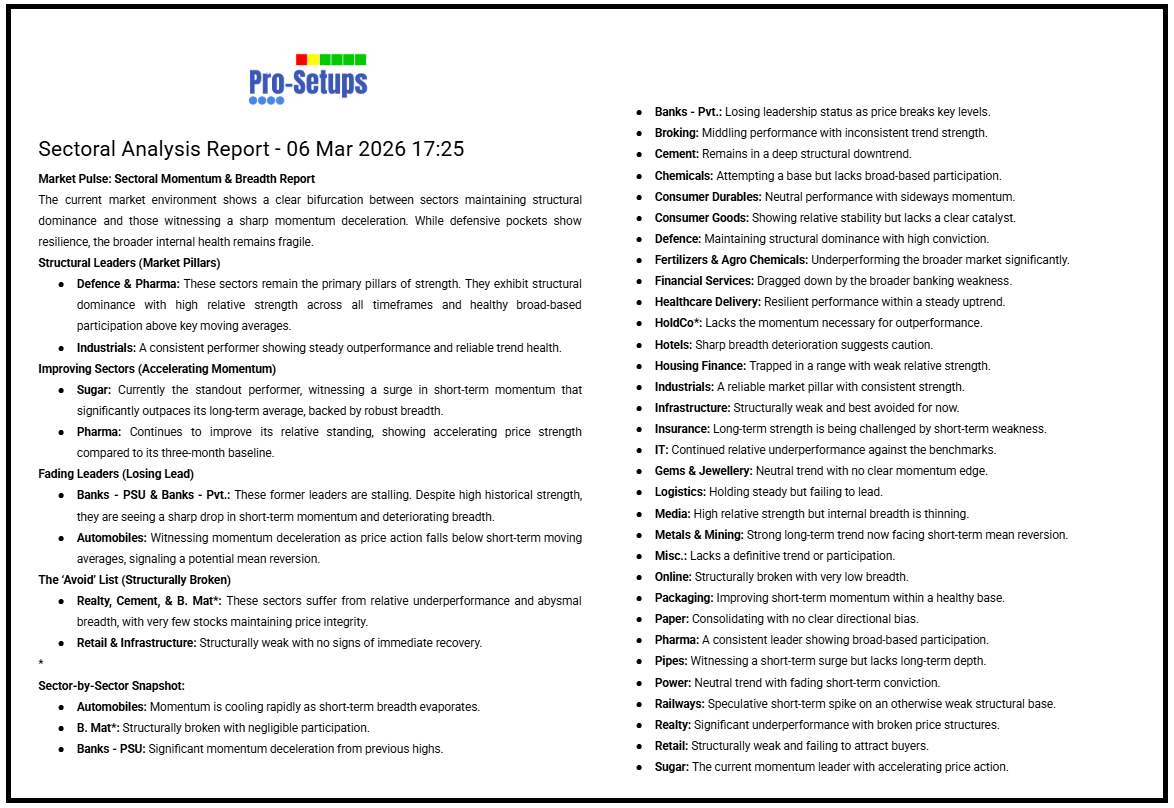
Sectoral Performance Analysis in Pro-Setups Dashboard
The Sectoral Performance page in our Pro-Setups Dashboard now provides detailed analysis of sectors showing strength, gaining momentum, improving trends, fading leadership, and structurally broken sectors, helping you clearly identify sector rotation in the market. The analysis is updated everyday after market hours.
Technical Perspective
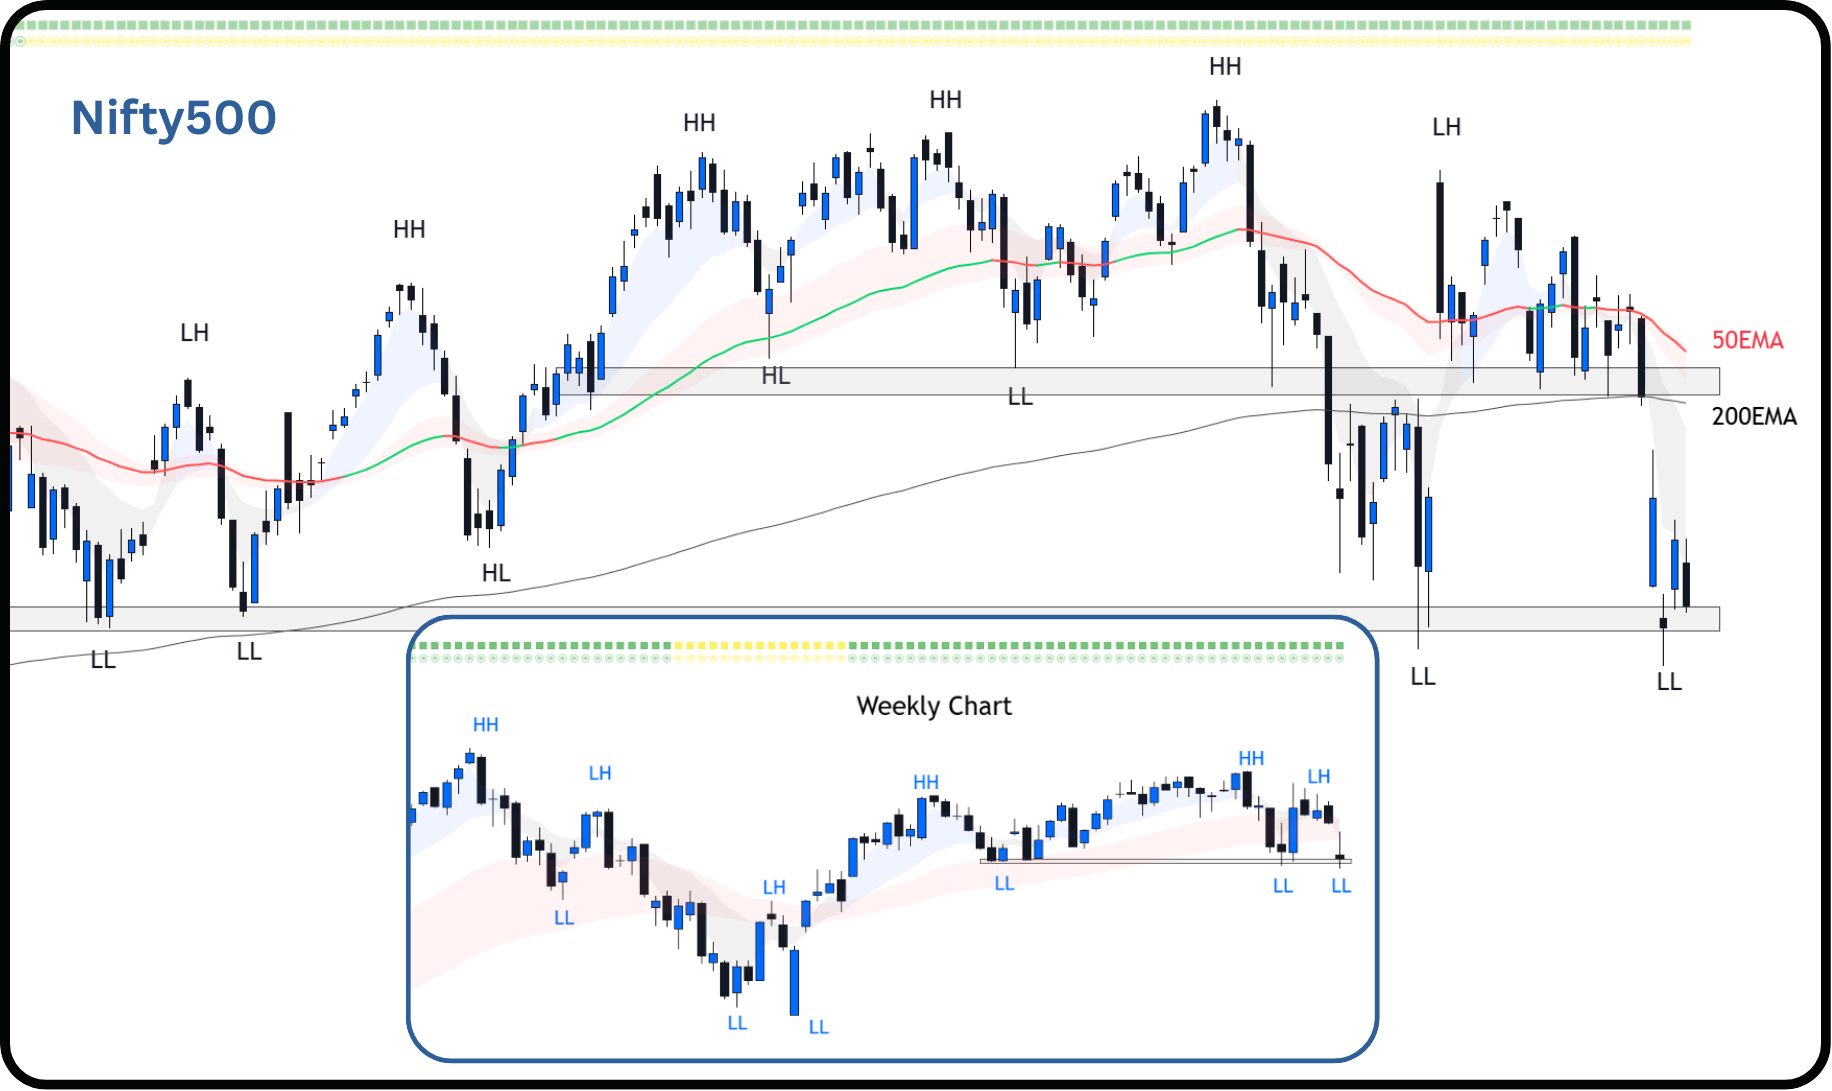
Establishment of Lower Low (LL): Nifty500’s recent price action has established a fresh Lower Low (LL) near the budget day lows at around 22,280.
Testing the 200EMA: Last week, Nifty500 closed the week at its 200EMA, which served as a vital structural floor. A break below accelerated selling toward the 22,400-22,500 levels, which was previous support zone.
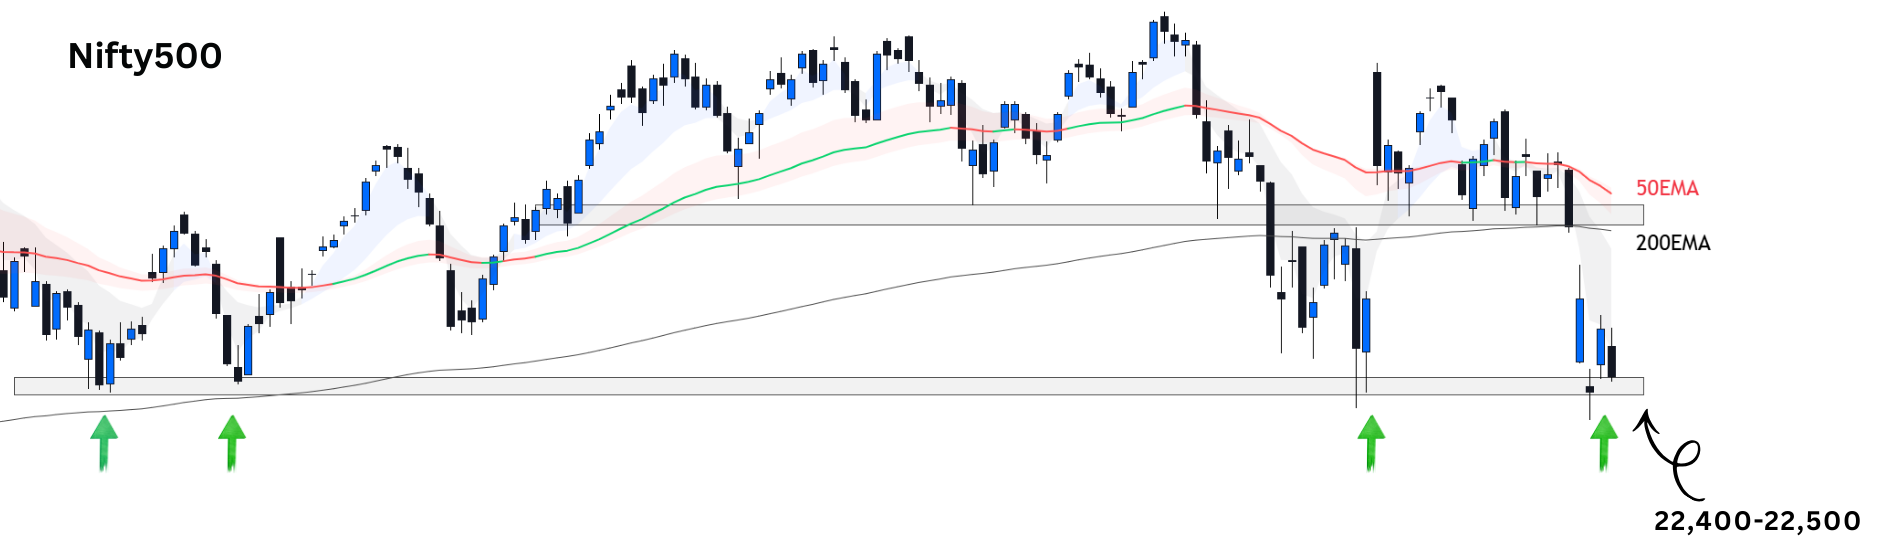
Immediate support & resistance zones: Immediate support for the Nifty500 is seen at the 22,400-22,500 zone. On the upside, 23,100, will act as a resistance, a zone where the price will be meeting the declining 50EMA and 200EMA.
Bearish alignment: All shorter-term moving averages remain in a perfect bearish alignment (10EMA<20EMA<50EMA).
The reason we track Nifty500 is because it represents over 90% of the free float market capitalization, making it a comprehensive barometer of market health.
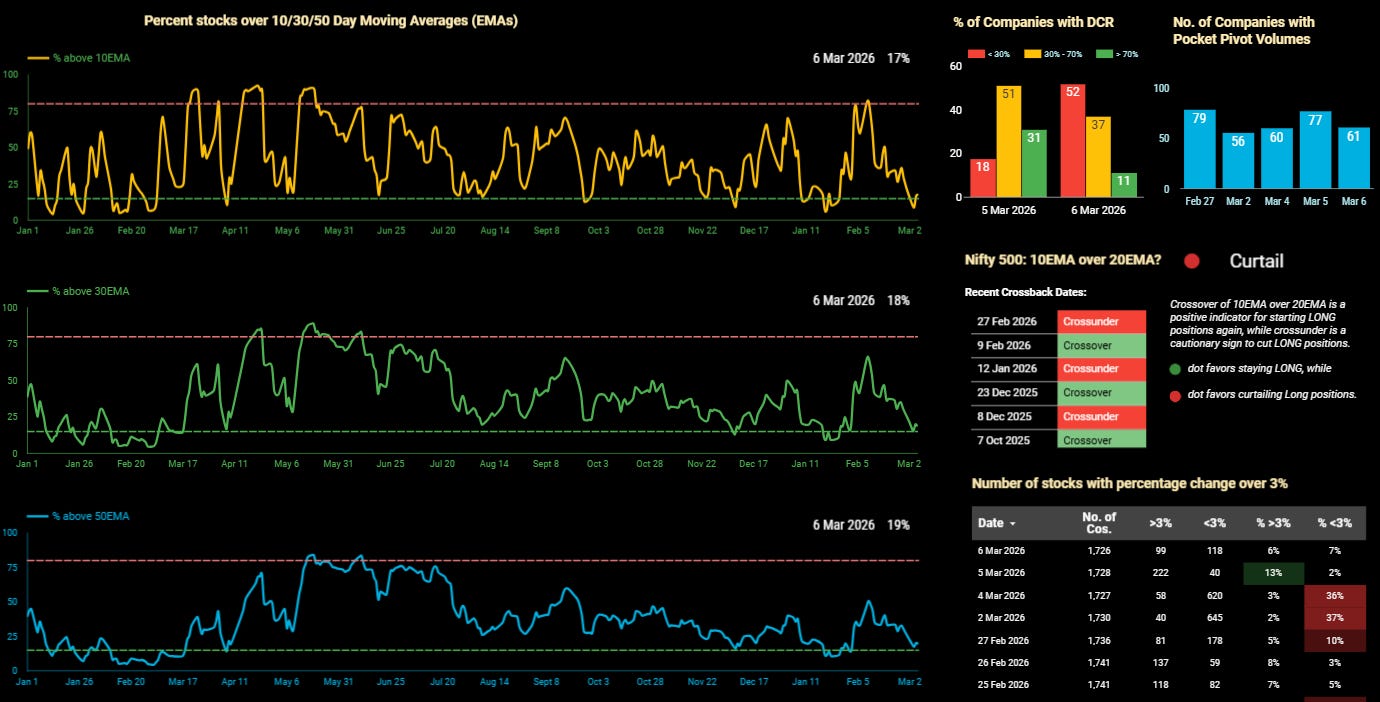
Nifty500’s 10EMA crossed under its 20EMA on 27th February triggering a ‘Caution’ signal that suggests curtailing long positions.
Participation collapsed this week, indicating that individual stocks are struggling to maintain the momentum seen earlier in the month.
All three major breadth indicators are now below 20%, signifying deep correction. This indicates that roughly 80% of the stocks are now trading in a downtrend across all timeframes.
10EMA: 17% of stocks are now trading above their 10EMA, compared to healthy 29% last week.
30EMA: 18% of stocks are above their 30EMA, compared to 31% last week.
50EMA: 19% of stocks are above their 50EMA, compared to 30% last week.
The structural stability (50EMA) has broken down, falling from 30% to 19%. This suggests that many of the stocks that were holding onto medium-term support last week have also given way.
Historically, breadth levels below 20% levels often precede a short-term relief bounce.
Capital preservation is the priority until the 10EMA breadth can reclaim the 50% level and the 10/20 EMA triggers a fresh Crossover.
It is important to note that overbought or oversold signals are most relevant for swing traders, as they reflect short-term momentum shifts.
Accessing Market Breadth on Pro-Setups Dashboard is available for all readers. Click on the link below.
Summary
The market is in a technically weak zone, pressured by institutional selling and geopolitical tensions in West Asia. The Nifty500 established a fresh Lower Low. Technical indicators remain bearish, as market breadth has collapsed below 20% across all timeframes. While historically these oversold levels can precede a relief bounce, the current outlook favors capital preservation and defensive positioning until key resistance levels and moving average crossovers are reclaimed.
 | A guest post by
|