
2026#11: From Panic to Opportunity
Inside Nifty500’s Death Cross, Oversold Breadth and the Tactical Path for Swing & Positional Traders


The Indian stock market witnessed one of its most turbulent weeks in recent history. The benchmark Nifty50 plummeted 5.31% for the week, while the Nifty500 followed suit with a sharp weekly decline of 4.85%, reflecting the deep and broad-based nature of the sell-off across large, mid, and small-cap segments. The selloff was driven primarily by surging crude oil prices above $100 per barrel, persistent geopolitical tensions in the Middle East, and continued FII outflows amid global risk‑off sentiment.
Key Indices Performance
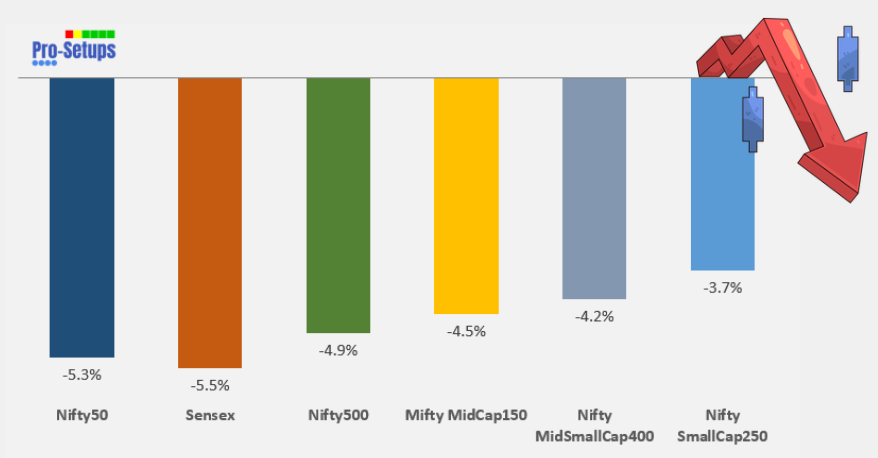
The selling pressure was visible across most sectors and market-cap segments.
Key Drivers for the Market
Geopolitical Escalation in West Asia: The primary catalyst for the market crash was the intensification of the conflict in West Asia, involving Iran, Israel, and the United States. This raised fears of a wider regional war, triggering a global risk-off move.
Crude Oil Price Shock: Brent crude prices surged back above the $100/barrel mark due to fears of a supply crunch and the potential closure of the Strait of Hormuz. Higher oil prices directly hurt India’s import bill, inflation outlook, and corporate margins, amplifying the market’s downside reaction.
Rupee Volatility: The Indian Rupee plummeted to a fresh record low, crossing over ₹92/USD. The sharp depreciation not only spooked foreign investors but also raised concerns over imported inflation and potential pressure on the current account deficit.
Technical Perspective
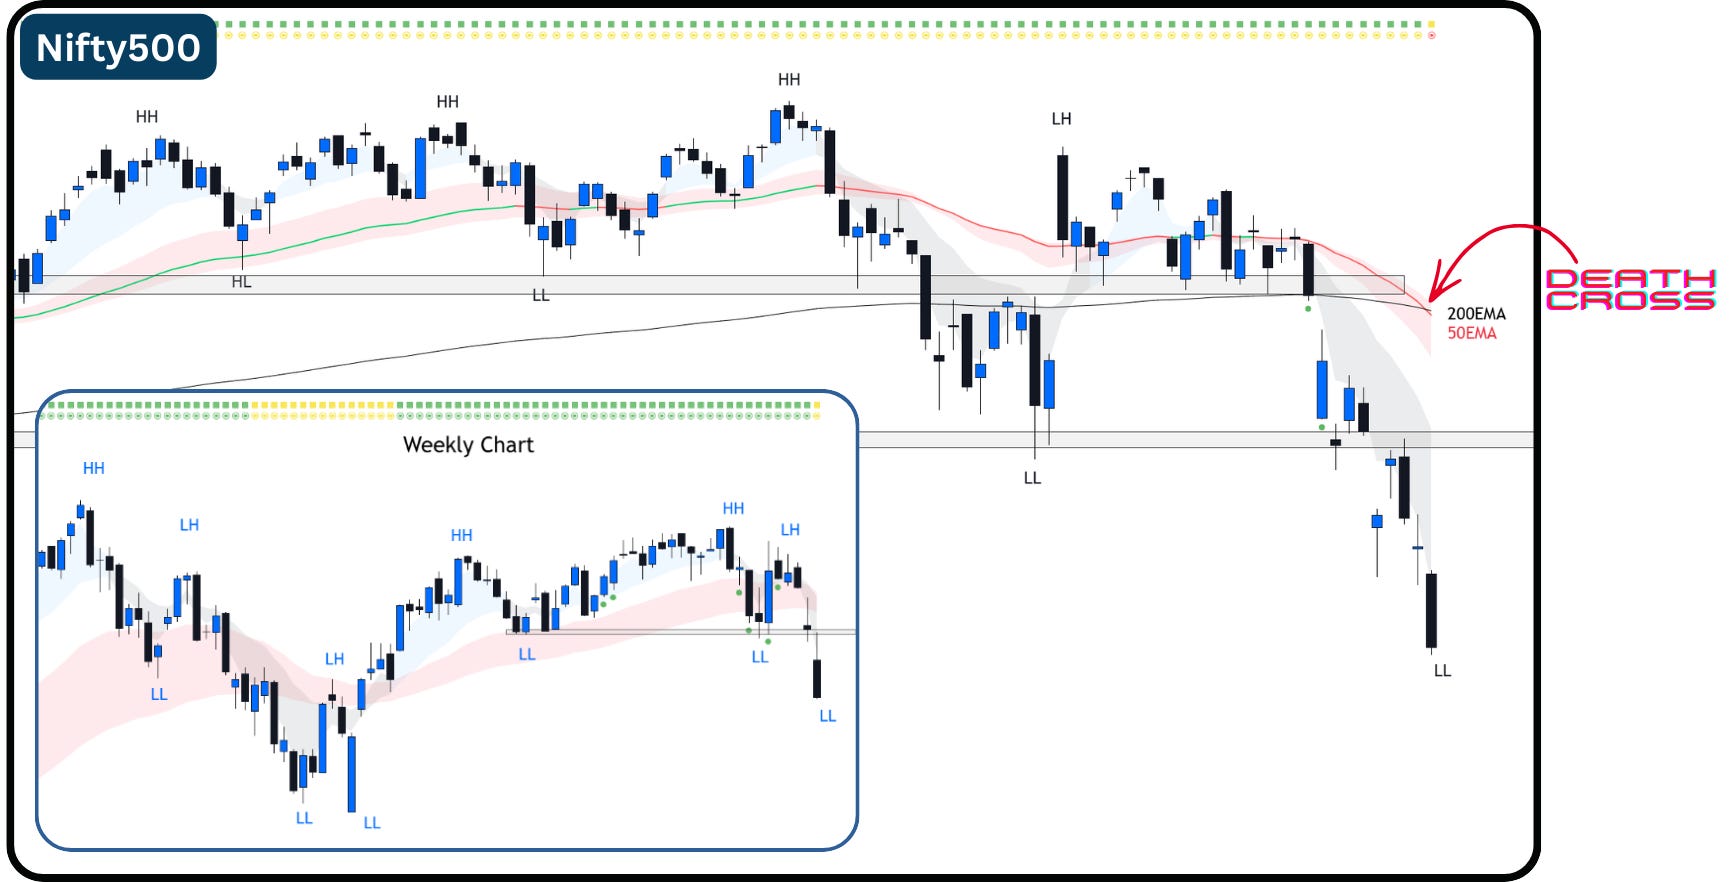
Establishment of Lower Low (LL): Nifty500’s recent price action has established a fresh Lower Low (LL).
Support Zone Broken: The Nifty500’s earlier support zone around 22,400-22,500 has been breached. The index briefly retested this level but failed to take control of it and slipped below it again.
Death Cross: We made a death cross on Nifty500 on Friday. A death cross is a situation when 50EMA crosses under 200EMA, and it is considered negative in trading community. Probably, it’s time to check your wardrobe for the party that could be starting soon in a month or two.
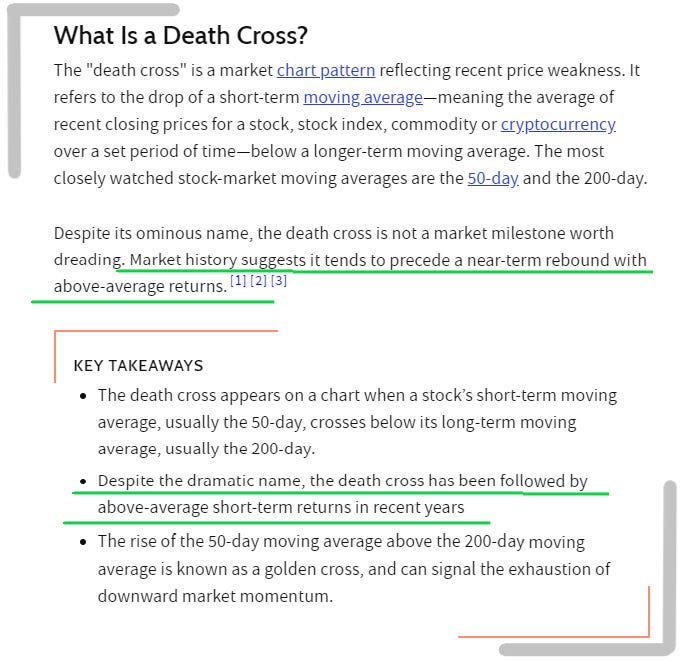
Here is what Investopedia says about a death cross.
50EMA and 200EMA are not magic lines, but they’re important because traders worldwide take action based on them.
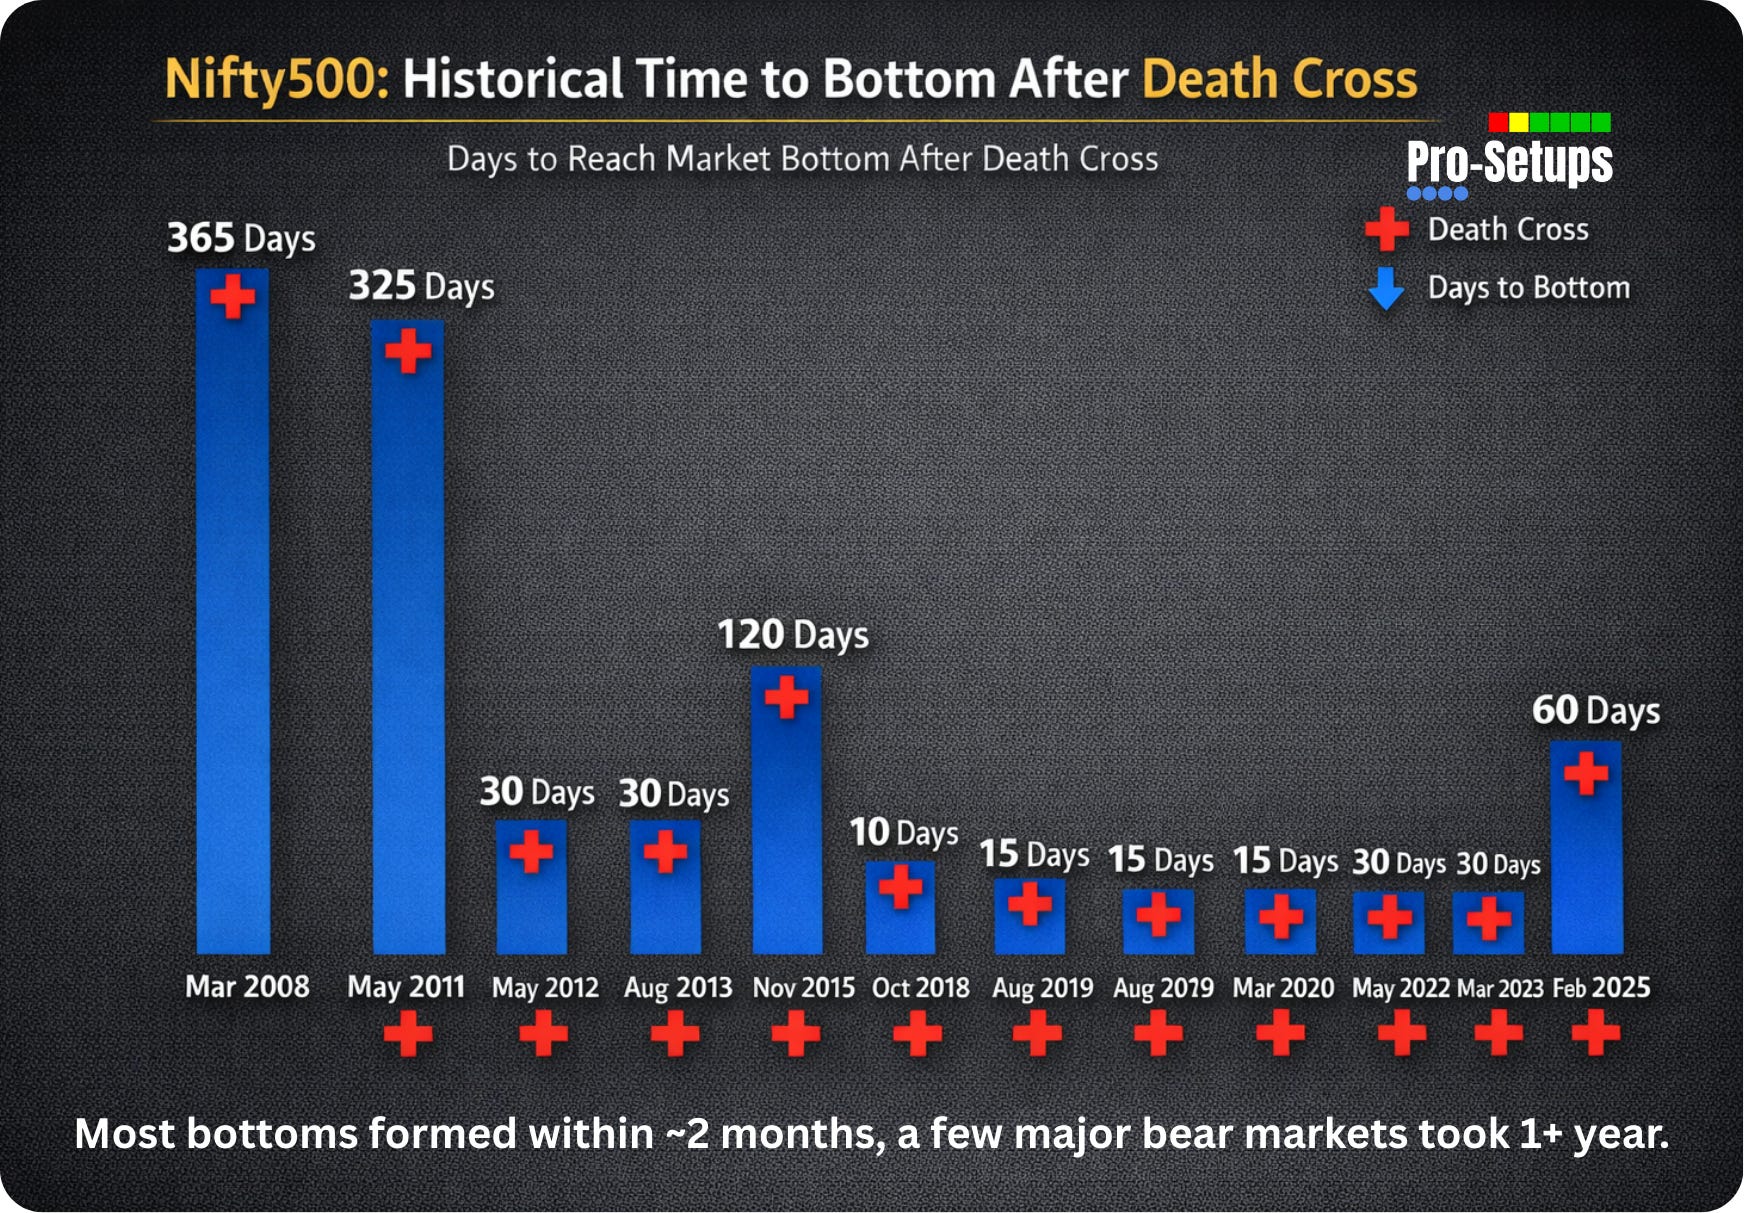
Previous Death Crosses on Nifty500: If history is to repeat again, then there is a high probability that we will be making market bottom very soon. Have a look at some of the previous death crosses, and notice the days taken to make the bottom after the death cross.

The reason we track Nifty500 is because it represents over 90% of the free float market capitalization, making it a comprehensive barometer of market health.
Broader Market Capitulation & The Mean Reversion Signal
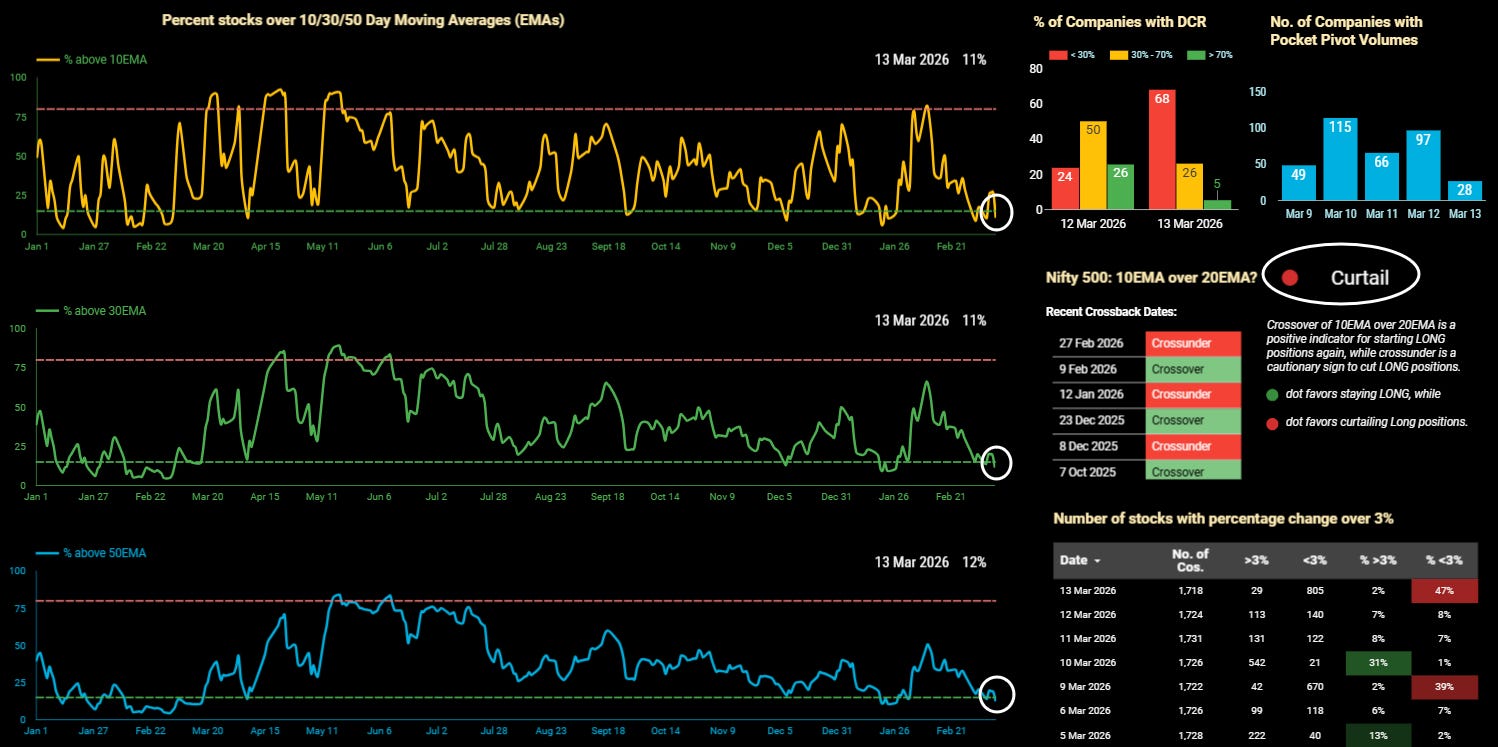
The Nifty 500 is now in a deeply Oversold zone, characterized by a significant deterioration in the market participation. With the 10/20EMA bearish crossover confirmed on February 27th, the short-term trend has shifted to a defensive posture. However, current breadth indicators - showing 88% of constituents trading below their respective 10, 30, and 50EMAs - suggest the market is probably nearing a point of seller exhaustion.
Strategic Interpretation:
Structural Health: While the ‘Caution’ signal mandates capital preservation for momentum-based strategies, breadth readings below the 12% threshold historically coincide with oversold zone.
The ‘Washout’ Phase: This lack of resilience represents a classic mean reversion setup. In professional terms, the ‘weak hands’ have mostly been flushed out, and the index is now trading at a technical extreme that typically precedes a relief rally.
Execution Alpha: For the disciplined investor, the priority is to identifying high-quality names with healthy valuation comfort (Valuation Grade A, A+, B and B+ in the Valuation Grade in the Pro-Setups Dashboard) that have maintained relative strength despite the broader index breakdown.
Accessing Market Breadth on Pro-Setups Dashboard is available for all readers. Click on the link below.
Summary
There is an absolute absence of broad-based participation, and even the narrow leadership that held the index earlier in the month has vanished. While the deeply oversold breadth readings suggest the selling may be exhausted in the immediate term, investors should remain cautious until the index demonstrates a meaningful recovery in its structural base. The current outlook favors capital preservation and defensive positioning until key resistance levels and moving average crossovers are reclaimed.
 | A guest post by
|