
2026#13: March Down ~9%
Middle East fears + energy shock push markets to new lows.


The broader trend stayed negative, with March 2026 turning into one of the toughest months in recent years (down over 9% with one trading day still left). The Nifty500 saw multiple consecutive losing weeks, with gap-down openings and selling on every bounce. This week started with a sharp fall on Monday, followed by a brief mid-week recovery, but the momentum didn’t sustain. On the final trading day, benchmark indices saw a sharp sell-off of over 2%. Markets initially moved up on hopes that the Middle East conflict might ease, but sentiment weakened again toward the end of the week as mixed and uncertain headlines reduced confidence in a near-term resolution.
Key Indices Performance
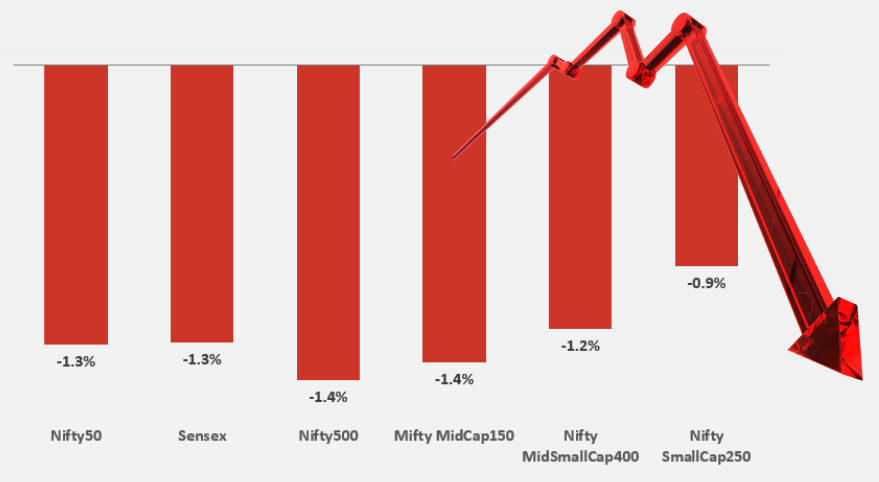
Key Drivers for the Market
Overall sentiment remained weak, with the Middle East conflict and sharp moves in energy prices keeping risk appetite in check. Major global markets, including the US and other developed economies, also ended the week on a mixed to negative note.
Geopolitical Escalation in West Asia: The main trigger for this volatility continues to be the ongoing tensions between the US, Iran, and Israel, which have now entered the fourth week, keeping uncertainty elevated.
Crude Oil Price Shock: After falling to $92 per barrel, crude prices climbed back above $110 per barrel amid fears of supply disruption. For India, higher oil prices increase the import bill, push inflation higher, and put pressure on corporate margins leading to a negative impact on market sentiment.
Rupee Volatility: The Indian Rupee fell to a new record low, slipping past ₹94.75 per US dollar.
Corporate Earnings Season Kick-off: With the financial year coming to a close, focus now shifts to corporate earnings. Investors will closely track how companies performed in the last quarter of FY26 and how they factor in rising energy costs and currency weakness while giving guidance for FY27.
Technical Perspective
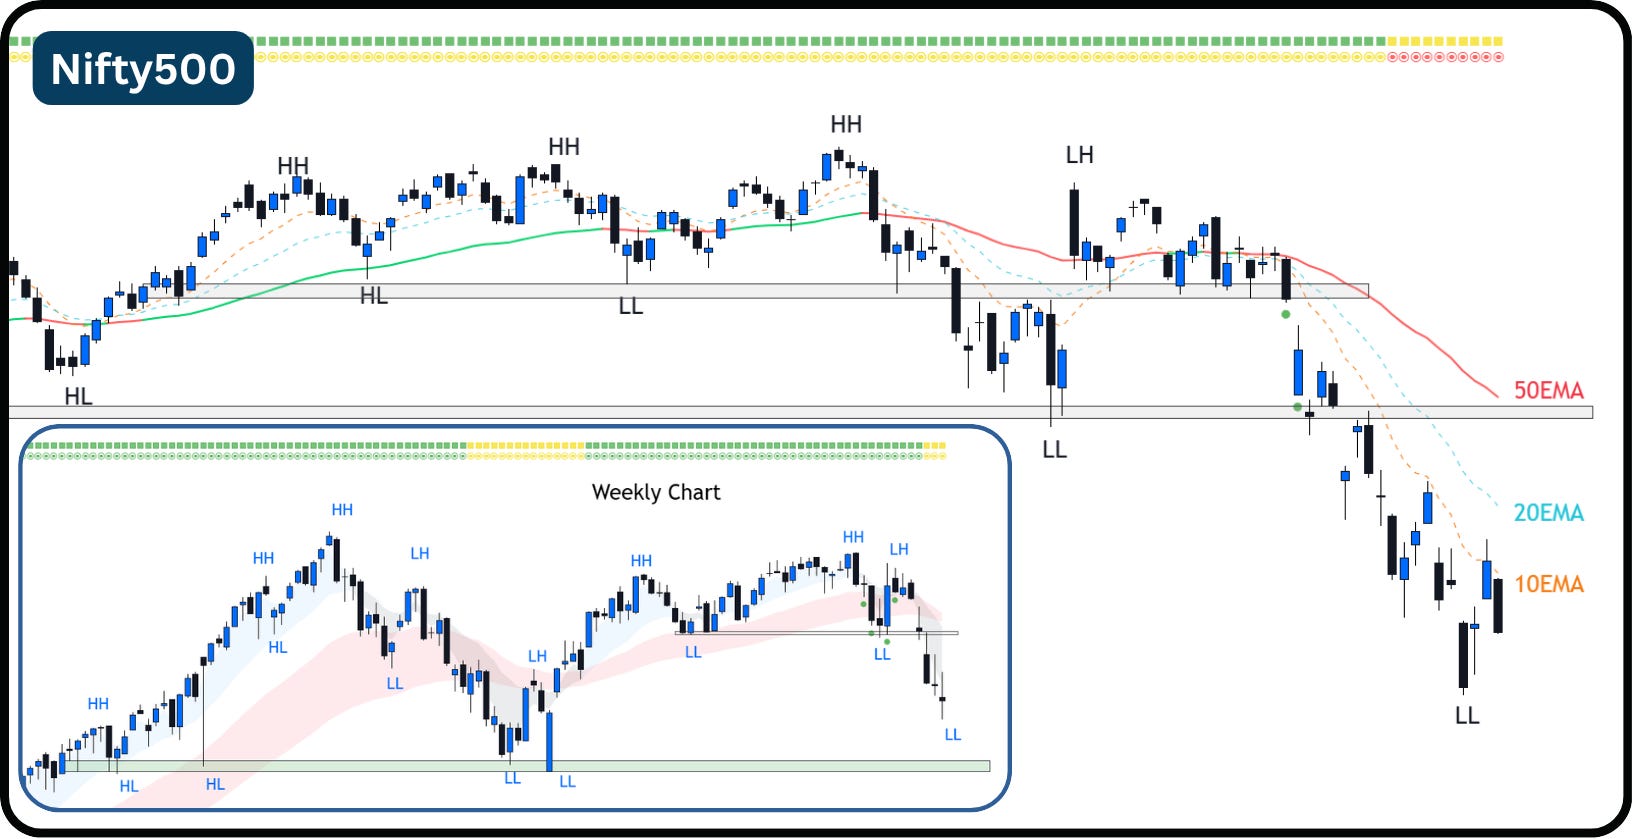
Establishment of Lower Low (LL): Nifty500’s recent price action has established a fresh Lower Low (LL).
Strong Resistance from 10EMA: The Nifty500 continues to show strong downward momentum, repeatedly facing resistance near the falling 10EMA..
The reason we track Nifty500 is because it represents over 90% of the free float market capitalization, making it a comprehensive barometer of market health.
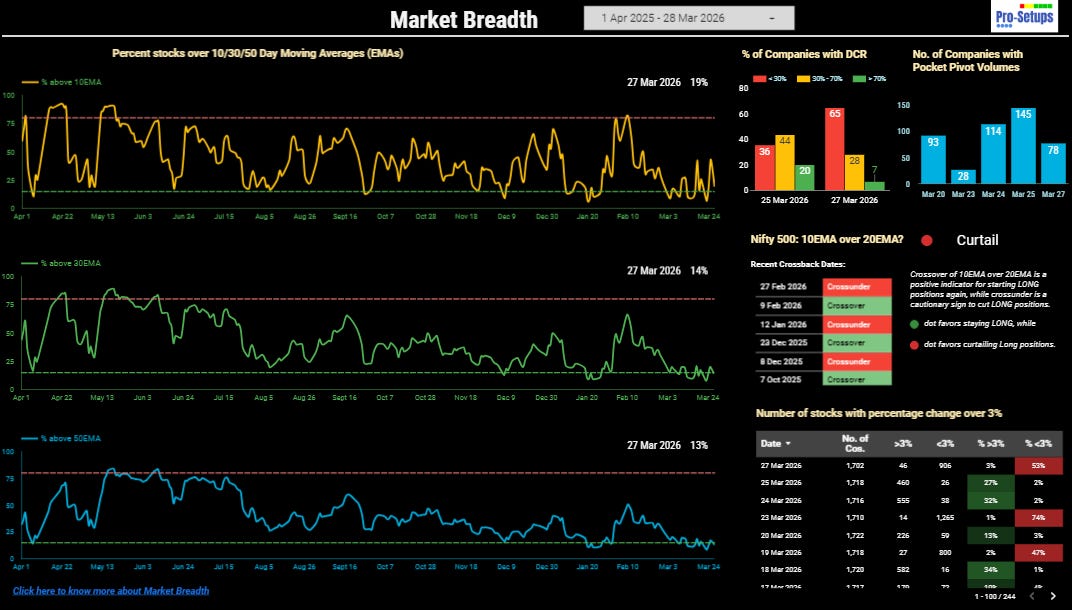
Breadth Comparison & Inference
The market experienced a sharp erosion in its breadth, wiping out the temporary gains seen mid-week. While Wednesday showed a flash of hope with 43% of stocks trading above their 10EMA, that momentum has completely vanished, with only 19% remaining above that level by the end of the week. Compared to last Friday (20th March), when 26% of the stocks held above their short-term EMAs, current data confirms a significant deterioration in sentiment. This downward shift suggests that the mid-week recovery was a fleeting moment of selective participation rather than a sustainable shift in the broader market.
Strategic Interpretation:
Structural Health: From a technical perspective, the index appears to be structurally weak. With a mere 13% of stocks trading above their 50EMA, the vast majority of the market is in a primary downtrend. This is a concerning drop from the 17% seen on Wednesday and sits even lower than last week’s 16% reading. When such a small fraction of the market holds its long-term trend, the underlying environment remains inherently fragile. The ‘Curtail’ signal on the 10/20 EMA crossover remains persistent, acting as a red flag for any aggressive positioning.
Near Oversold, but not there yet: While the 30EMA and 50EMA metrics have both slipped into deep distress at 14% and 13% respectively, the 10EMA still sits slightly higher at 19%. Because all three metrics are not yet simultaneously below 15%, the market has not officially entered a potential oversold zone. This indicates that while the selling has been intense, we haven't quite reached the point of final exhaustion or capitulation.
Execution Alpha: For the disciplined investor, the priority is to identify high-quality names with healthy valuation comfort (Valuation Grade A, A+, B and B+ in the Valuation Grade in the Pro-Setups Dashboard) that have maintained relative strength despite the broader index breakdown.
Accessing Market Breadth on Pro-Setups Dashboard is available for all readers. Click on the link below.
High returns and fast growth are the engines of valuation. To find a true winner, you have to look at how much a company earns on its capital (ROE) and how fast it is moving (Growth). Read Part I of our article on Valuation’s Dynamic Duo: Why RoE and Growth Rates Matter.
Part I - Valuation's Dynamic Duo: Why RoE and Growth Rates Matter

In this first part, we explore how Return on Equity and Growth rates work together to reveal a stock's true potential - and why the popular PEG ratio often falls short.
Summary
The combination of a fragile structure and the rapid evaporation of short-term momentum suggests that the index is struggling to find stable footing. Until we see a broad-based expansion in the number of stocks reclaiming their moving averages, the outlook remains defensive with a focus on risk mitigation. Investors should remain cautious; until we see a meaningful crossover of the 10/20EMA on Nifty500 and a surge in 50EMA participation, the bias remains titled to the downside.
The current outlook continues to favor capital preservation and defensive positioning until key resistance levels and moving average crossovers are reclaimed.