
2026#29: Benchmarks Hold Firm as Broader Market Momentum Weakens
The intermediate trend remains intact, but fading breadth and mid and small-cap weakness is an early warning for investors.

Weekly Market Update: Week Ended July 17th, 2026
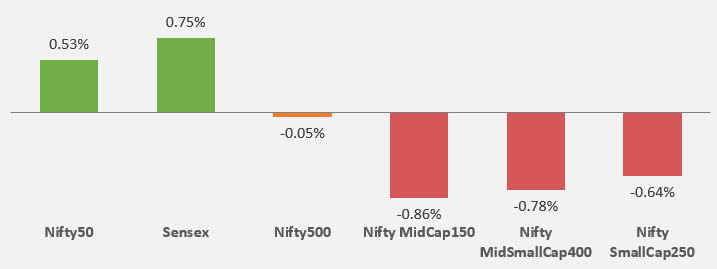
The market reversed its recent behavior, with benchmark indices (Nifty50 and Sensex) outperforming the broader market.
The Nifty500’s near-flat return shows that gains were concentrated in select large-cap stocks.
Mid and small-cap indices corrected after leading the market in the previous week.
Broader market weakness was influenced by:
Geopolitical tensions in the Middle East
Rising crude oil prices
A weakening rupee
Technical Perspective: Nifty500
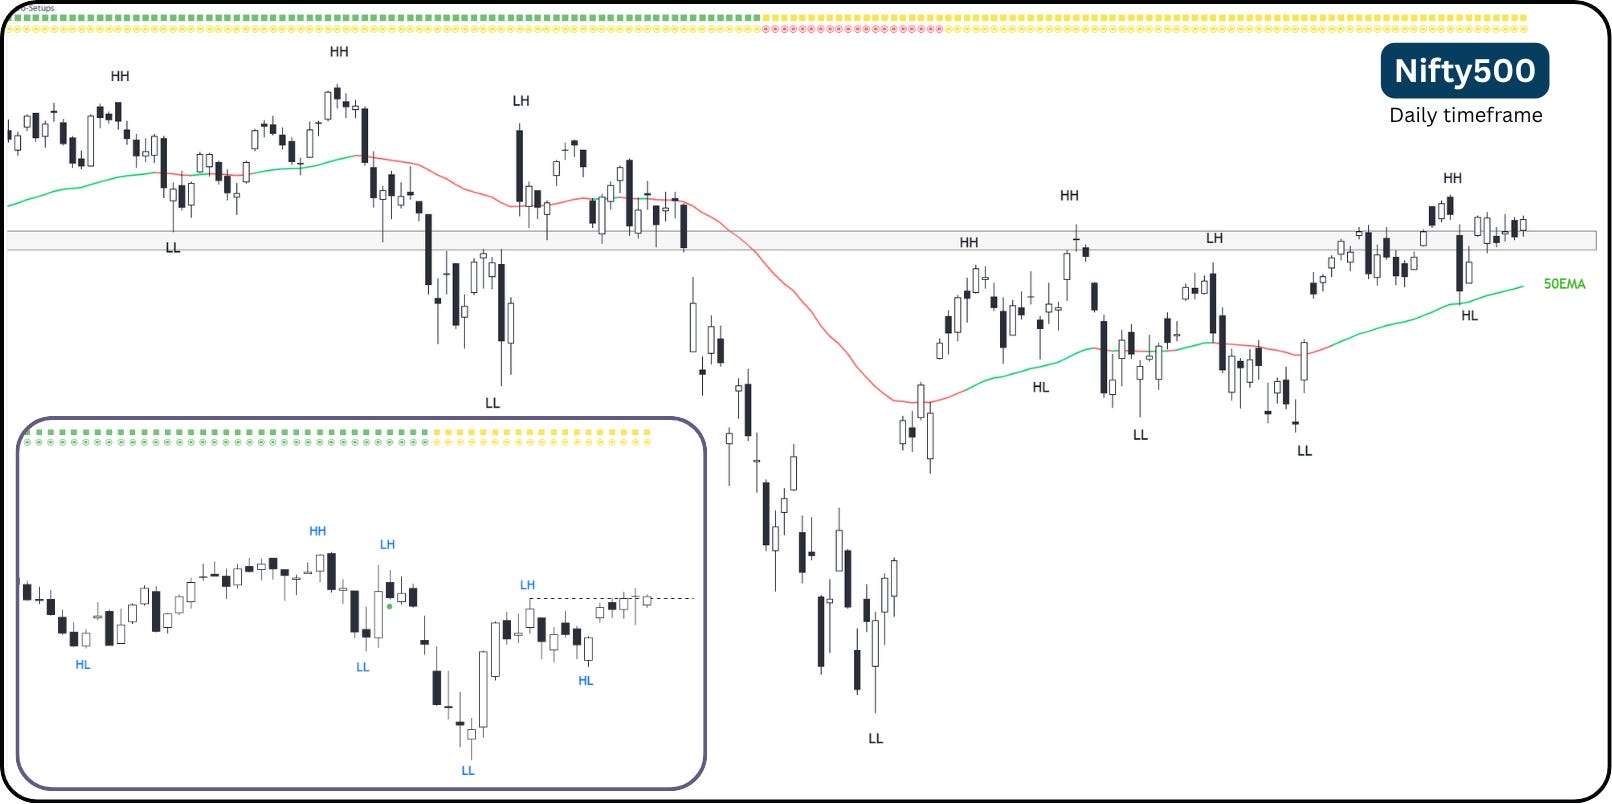
Daily Timeframe Chart
The Nifty500 remained largely directionless during the week, with price moving in a narrow range.
The index pulled back after forming a fresh Higher High but remained comfortably above its rising 50EMA, which is acting like a dynamic support area.
Price returned towards the recent breakout and resistance zone, though follow-through buying was missing.
A decisive move above the recent swing high is required to resume upward momentum.
A break below the recent Higher Low and 50EMA would indicate deterioration in the daily structure.
Weekly Chart
Nifty500 formed an Inside Bar, remaining within the previous week’s range.
It recorded its lowest weekly high-to-low range since January 2026, reflecting strong volatility contraction.
The index continues to test crucial Lower High from the previous downtrend.
A breakout above the previous week’s high and the weekly Lower High would strengthen the case for a sustained long-term uptrend.
Mid and Small Cap indices
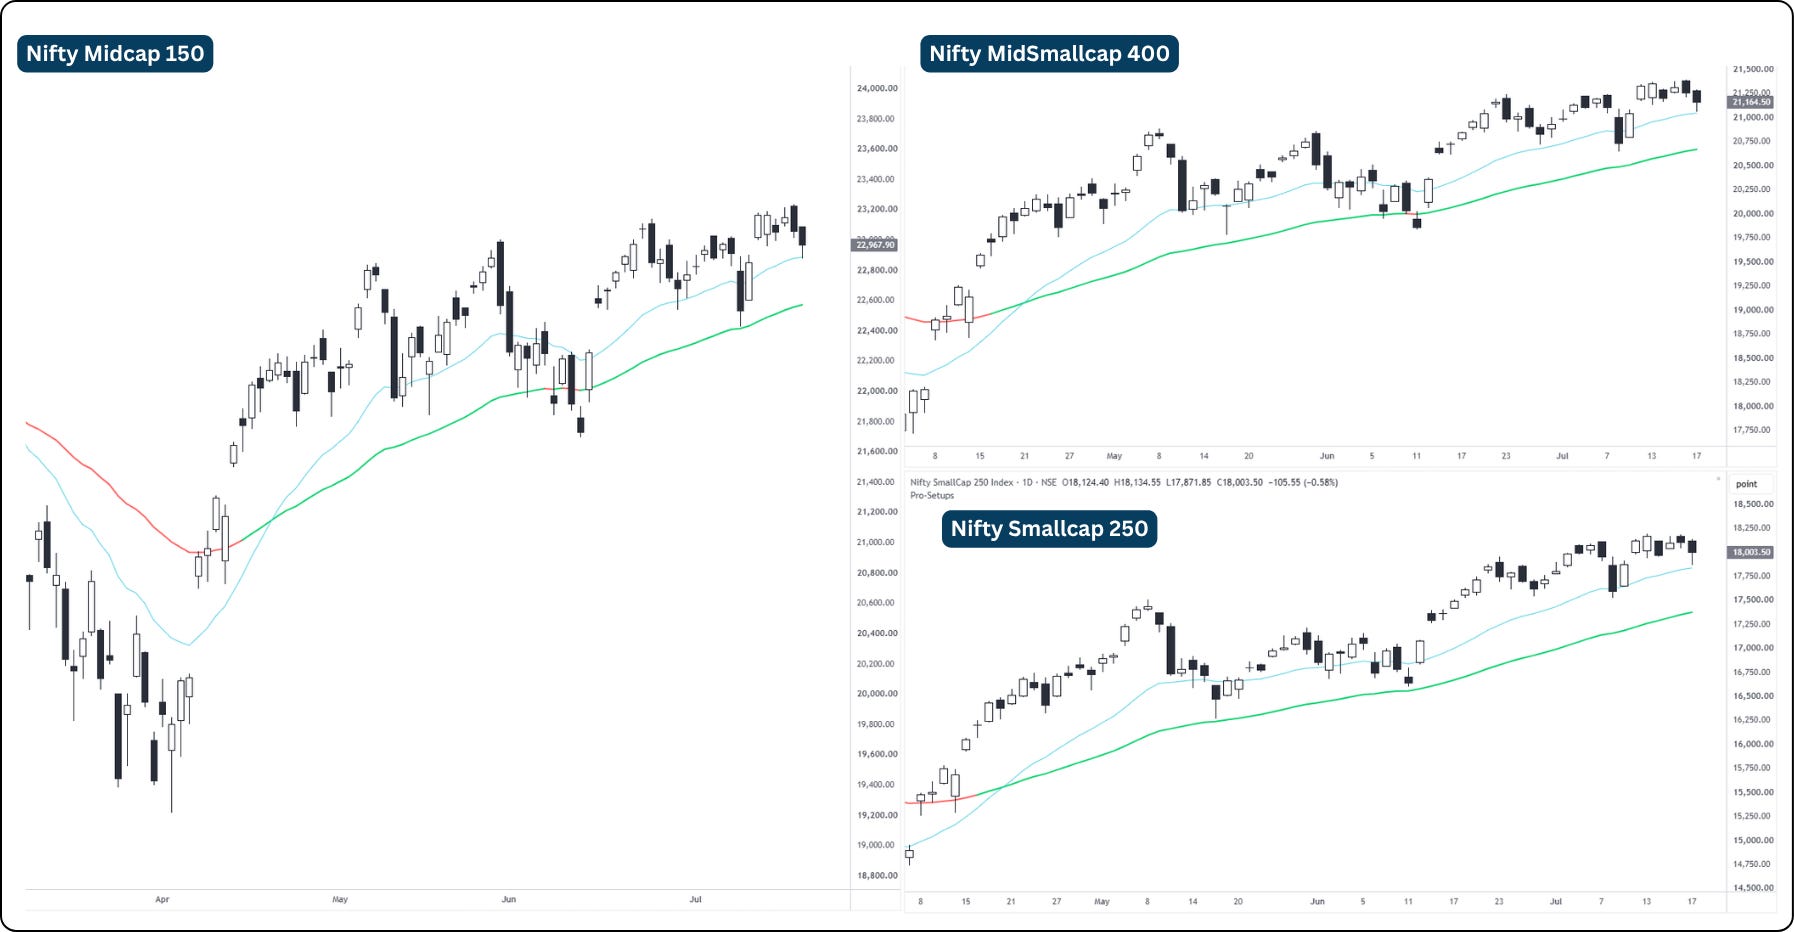
Mid and small-cap indices provided a clearer view of underlying market weakness. All three indices corrected from their recent highs.
Despite the underperformance, all three indices continue to trade above their rising short and intermediate-term moving averages, keeping the broader trend positive, although short-term momentum has weakened.
The latest decline appears to be a pullback within an existing uptrend rather than a trend reversal.
A deeper break below these moving averages would indicate that the weakness is moving beyond routine consolidation.
The reason we track Nifty500 is because it represents over 90% of the free float market capitalization, making it a comprehensive barometer of market health.
Market Breadth
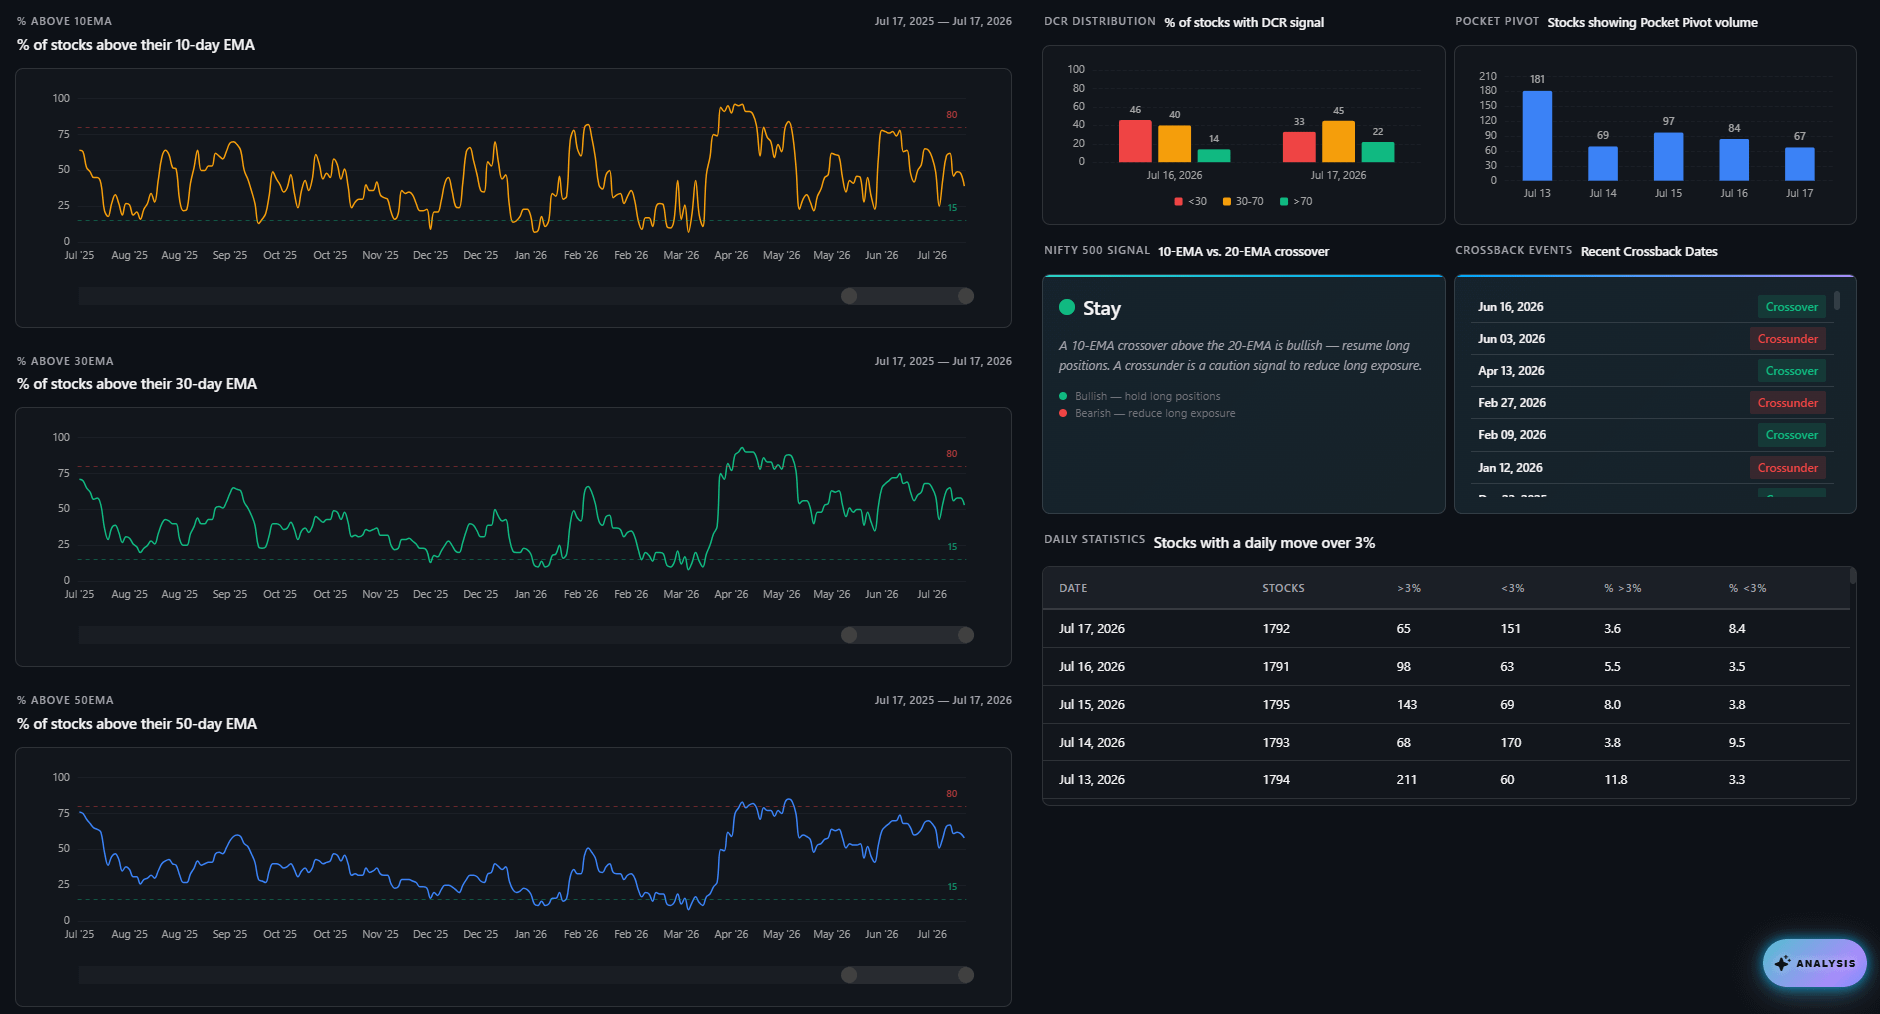
The Nifty500 continues to retain its ‘Stay’ signal, with the 10EMA remaining above the 20EMA following the bullish crossover on June 16.
Breadth reflects short-term deterioration but continued intermediate-term resilience.
10EMA: 39% of stocks are now trading above their 10EMA, a fall from robust 60% last week.
30EMA: 53% of stocks are above their 30EMA, compared to 63% last week, reflecting signs of a momentum cooling off in medium term outlook.
50EMA: 58% of stocks are above their 50EMA, compared to 66% last week, indicating that the market has not yet reached a state where it lacks structural strength.
The higher readings above the 30EMA and 50EMA show that the intermediate-term structure has not yet suffered a broad breakdown. However, we are witnessing a bearish tilt where the short-term averages are being abandoned faster than the long-term trends, creating a fragile structure.
Although the structural foundation is holding for now, the rapid loss of short-term momentum is a warning sign.
Trading & Investment Strategy
The market currently favors a selective, stock-specific approach rather than broad-based buying.
Swing Traders:
Focus on stocks showing relative strength, tight consolidations or constructive pullbacks.
Prefer confirmed breakouts backed by volume and avoid extended or weak mid and small-cap stocks.
Positional Traders:
Hold existing winners while their price structure and key moving averages remain intact.
Make fresh allocations gradually in stocks showing strong relative strength and institutional accumulation.
Risk Management:
Keep position sizes moderate until the Nifty500 breaks out of its Inside Bar range and breadth improves.
Reduce exposure if weakness spreads to the 30EMA and 50EMA breadth indicators.
Summary
The intermediate structure and moving-average signal remain constructive, but short-term breadth is deteriorating rapidly.
Stay invested, but remain selective and risk-conscious.