
Back to Square One: Markets Return to Consolidation After Breakout Failure
Nifty500's failed breakout above 22,400-23,230 has led to a return to consolidation zone, creating the challenging sideways environment that traps both bulls and bears.

This week marked one year since benchmark indices made their all-time highs. The Indian stock market experienced a challenging week from September 23-27, 2025, with indices continuing their downward trajectory for the sixth consecutive session on Friday, driven by multiple headwinds including US tariff concerns, H-1B visa fee increases, and broad-based selling pressure across sectors.
Key Drivers This Week
Key market indices like Nifty50 and Sensex declined around 2.65% each. Both Midcap and Smallcap indices underperformed largecap indices as they declined by over 4% each.
US Tariff Concerns: Fresh concerns over additional US tariffs, particularly steep duties on pharmaceutical companies, weighed heavily on market sentiment.
H-1B Visa Fee Shock: Sharp increase in US H-1B visa fees created pressure on IT stocks, with the Nifty IT index declining around 8% this week.
GST reform optimism: Structural GST 2.0 reforms provide a buffer for a bullish long-term story, but short-term tariff concerns and geopolitical risks (Russia-Ukraine) create headwinds.
The upcoming RBI meeting date (Sept 29-Oct 1) will be a key event to watch in the coming week, as it may provide guidance on domestic interest rate trajectory and liquidity conditions.
Technical Perspective
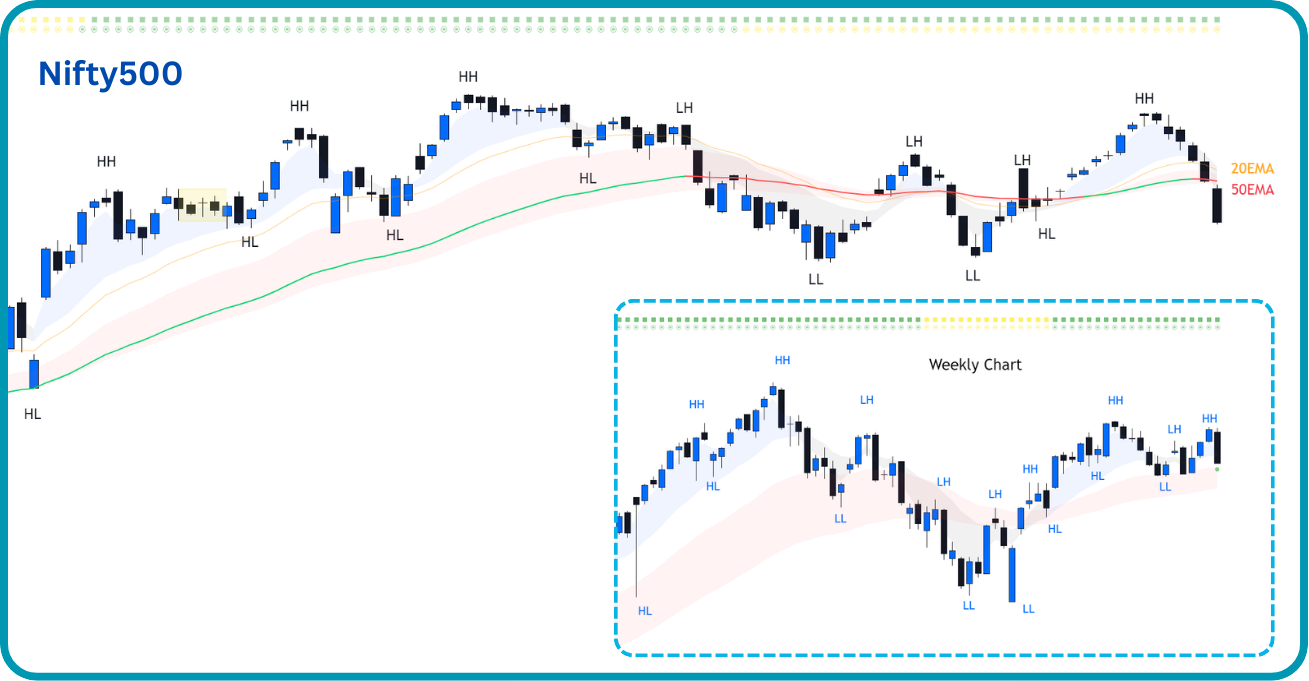
Nifty500 Trend: The Nifty 500 index exhibited significant bearish momentum during the week, breaking below critical short-term moving averages including the 10EMA, 20EMA, and 50EMA, indicating a clear deterioration in trend structure. The index closed at approximately 22,713, reflecting sustained selling pressure across the broader market.
Short-Term Levels: Contrary to earlier bullish expectations, the Nifty500 failed to sustain above its consolidation range of 22,400-23,230, with the index experiencing a decisive breakdown below these levels. The breakdown negated the anticipated upward momentum.
Support-Resistance Flip: The previously expected support zone of 22,400-23,230 failed to provide the anticipated cushion for the Nifty500, with the index breaking decisively below this range during the week.
The reason we track Nifty500 is because it represents over 90% of the free float market capitalization, making it a comprehensive barometer of market health.
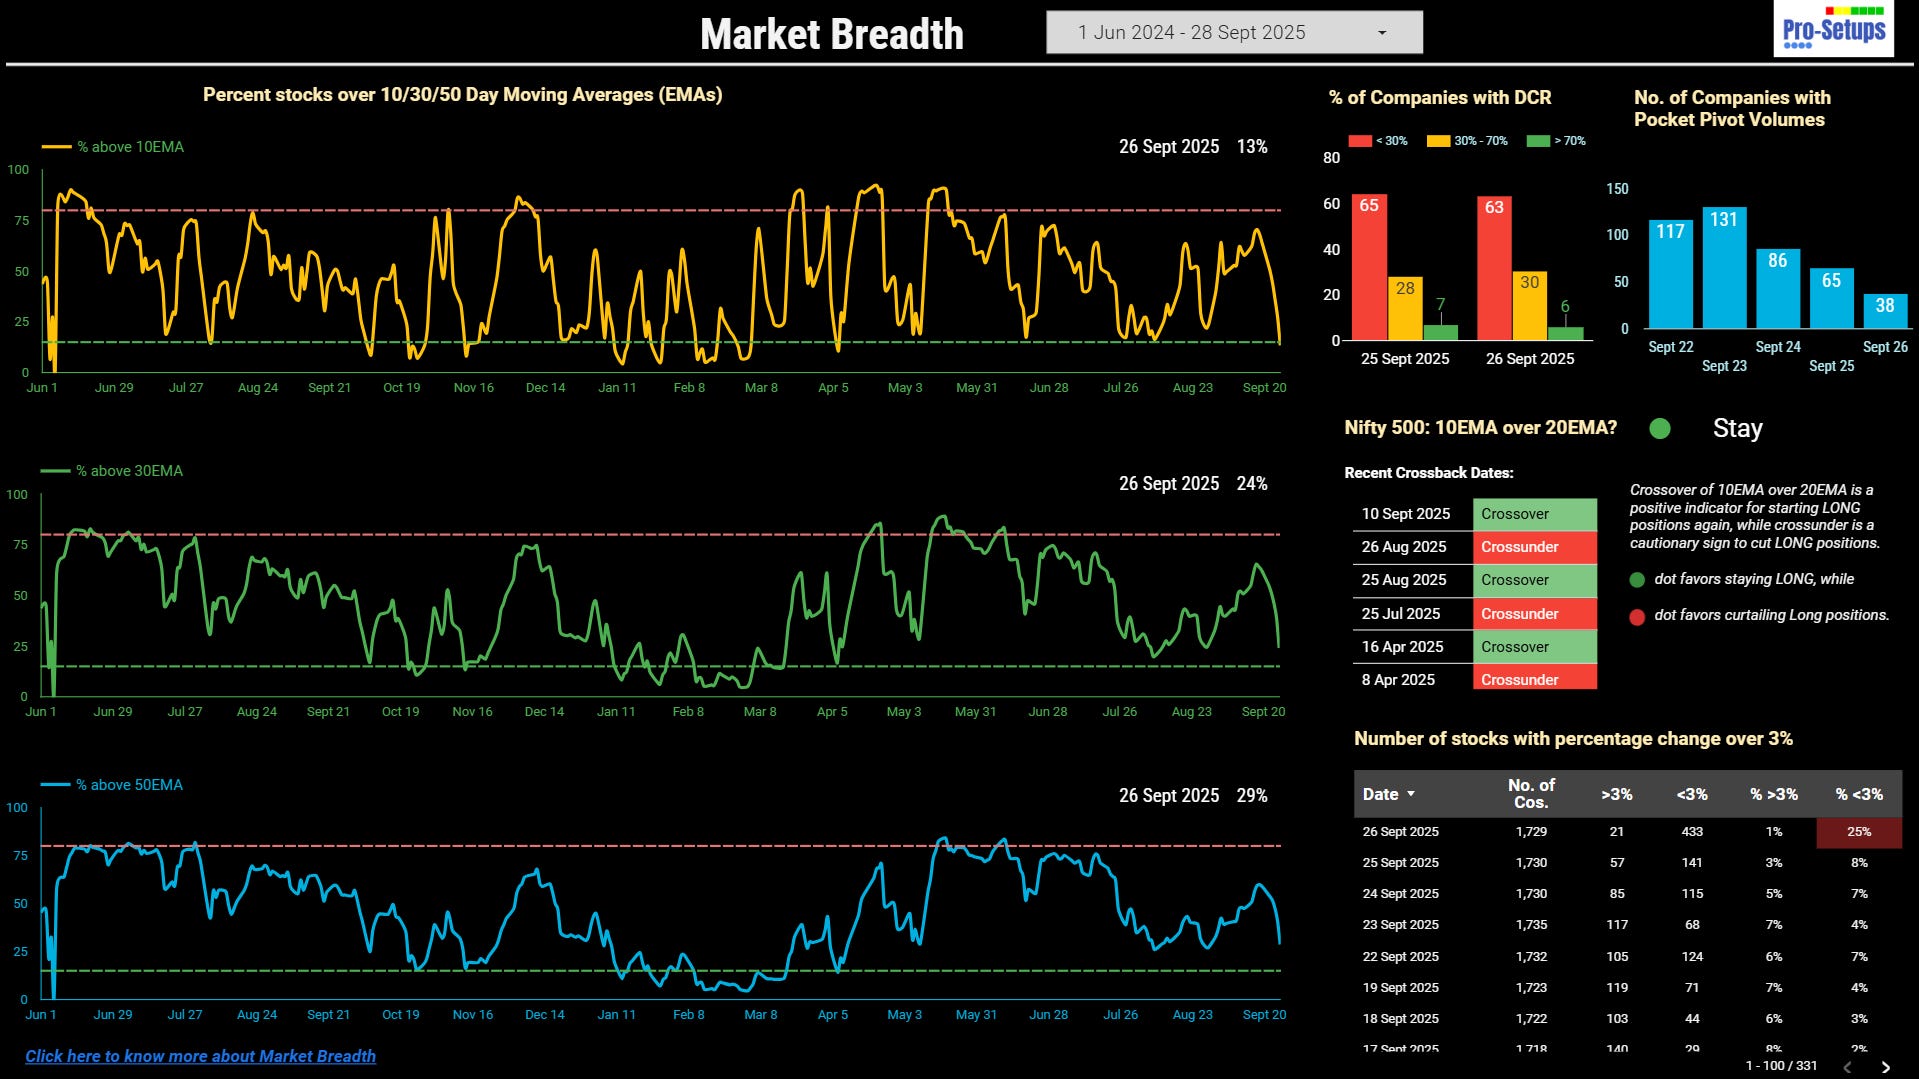
Market Breadth deteriorated significantly during the week, with the percentage of stocks trading above key short-term moving averages declining sharply. It is important to note that overbought or oversold signals are most relevant for swing traders, as they reflect short-term momentum shifts.
Over 25% of the stocks declined by more than 3% on Friday, which is an extreme reading.
While the Nifty 500’s 10EMA remains marginally above its 20EMA, both moving averages have entered a declining phase. Even with little or no movement by the index, will make 10EMA cross under the 20EMA giving us Caution signal to cut long positions.
The percentage of stocks above 10EMA have reached oversold zone, while percentage of stocks above 30EMA and 50EMA are very close to reaching that stage. We can expect some relief rally, when all three percentages reach oversol levels.
Accessing Market Breadth on Pro-Setups Dashboard is now available for free for all readers. Click on the link below.
Trading & Investment Strategy
We are currently experiencing a sideways market, and it is proving more dangerous than a clear bear market. In a sideways market, stock prices bounce up and down within a range without going anywhere meaningful. The current swings that our market is experiencing are wide.
Sideways markets are trickier than bear markets. In a bear market, the direction is clear - everything is falling, so we simply stay away and keep our money safe. But in sideways markets, prices keep giving false signals - they go up a bit, making us think it is time to buy, then they fall back down, making us think that it is time to sell.
The market shows weakness as the Nifty500 has fallen back into its 22,400-23,230 consolidation range after a failed bullish breakout. This false breakout trapped bullish traders and increases the likelihood of testing the lower boundary of the range.
Swing Traders: The trading environment has again changed from bullish to bearish. Caution is advised as the index has broken below key moving averages.
Positional Traders: Positional traders may want to focus on stocks showing strong relative strength in this tougher market phase.
Summary
The market is experiencing deepening weakness as it falls back into its consolidation range after a failed bullish breakout attempt. The Nifty500 had initially broken above its trading range of 22,400-23,230 but has since retreated back, creating a false breakout that trapped bullish traders and added to selling pressure. The failed breakout increases the likelihood of testing the lower end of the consolidation range. This environment favors a defensive approach with tight risk management until a decisive break above the established range provides clearer bullish directional signal.