
Digesting Gains with a Bullish Pause: What’s Next? Explore the Key ‘What If’ Scenarios!
Despite a flat week, market holds its bullish structure, pausing for a time correction rather than price correction. Read on for a quick 'What If' analysis exploring potential scenarios.

Market Sense
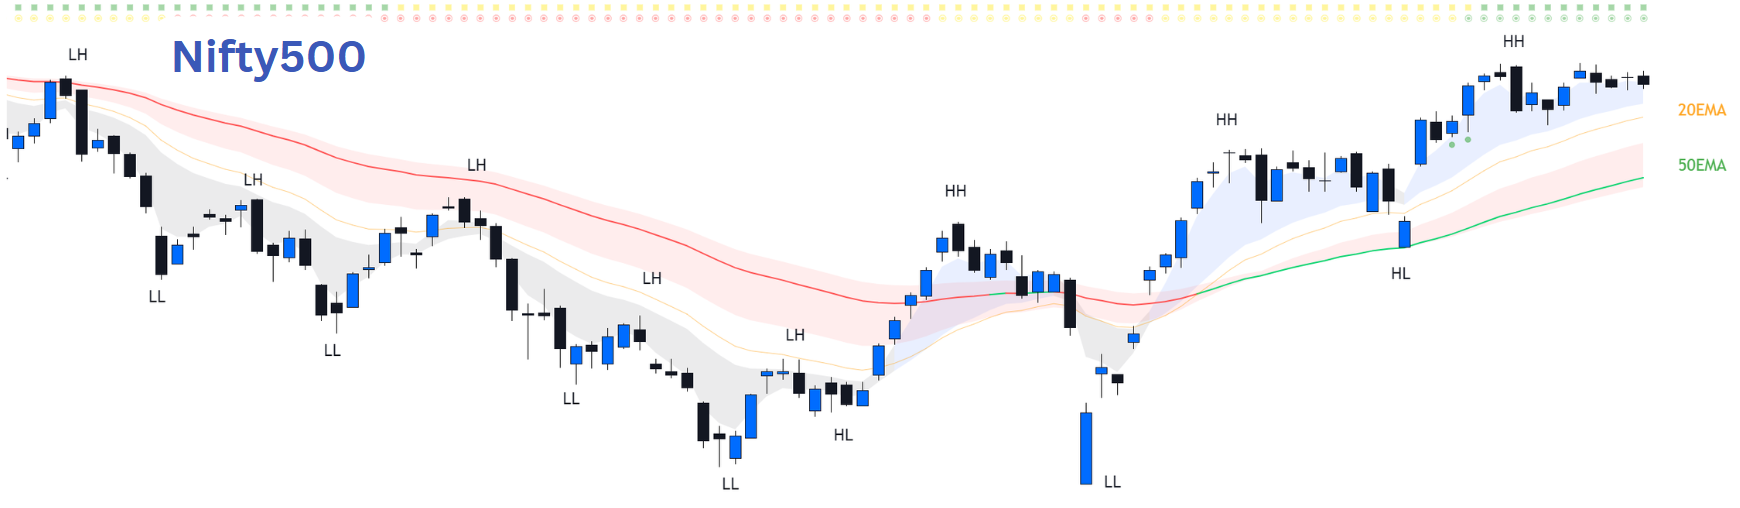
Weekly Market Update: Nifty500 Holds Uptrend Despite Pullback
The Nifty500 finished the week almost flat, pausing after a strong rally over the past month. Some profit-booking was expected, but the overall trend is upward. We plan to stick with this trend unless we see clear signs of the market changing direction. Profit booking is normal in a rising market, and right now there are no significant triggers suggesting a market decline. As highlighted previously, the earlier concerns - global trade issues, FII outflows, high valuations, weak corporate performance, and geopolitical risks have eased.
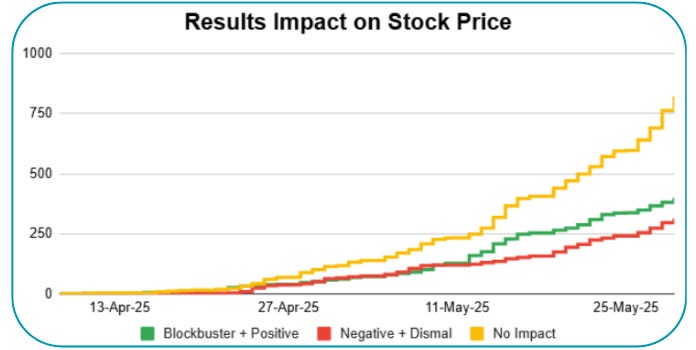
The earnings season has ended well, with more companies seeing their stock prices go up than down after results. We think the June quarter will be even better. If the RBI cuts interest rates or signals it might do so, it could give the market another boost and take it closer to previous highs.
The outlook remains positive for swing trading. As we head into next week, we expect that any dips or weakness should likely attract buying interest.
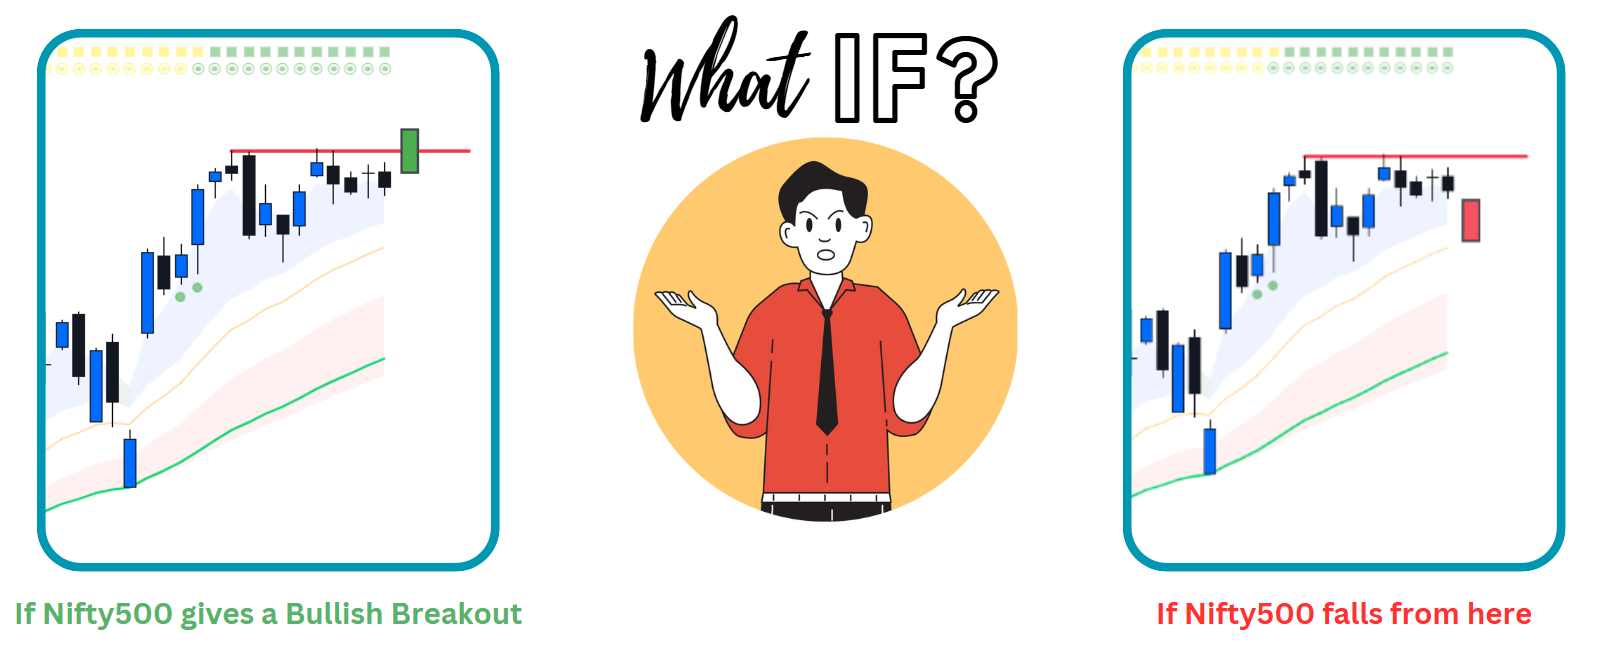
If Nifty500 gives a Bullish Breakout
A strong green candle would represent a decisive break above the current consolidation zone, confirming the bullish momentum that has been building. This breakout would likely spark fresh buying interest.
In this scenario, traders should consider taking aggressive long positions on the breakout confirmation. The momentum would likely attract fresh money, creating opportunities for both short-term and medium-term gains.
If Nifty500 falls from here
A decline would take Nifty500 to its crucial support level of 20EMA (orange line). This pullback would be a natural response after the strong month-long rally, allowing the market to digest recent gains. As long as the Nifty500 holds above the 20EMA, the overall bullish structure stays intact. However, swing traders may see their trailing stop losses triggered during this move. If the 20EMA fails to hold, the next support would be the 50EMA (green line).
Trading approach here would be to wait for Nifty500 to reach 20EMA support before considering fresh longs. However, fresh purchases should be avoided if the 20EMA is decisively broken, as this could signal a deeper correction ahead.
Market Breadth
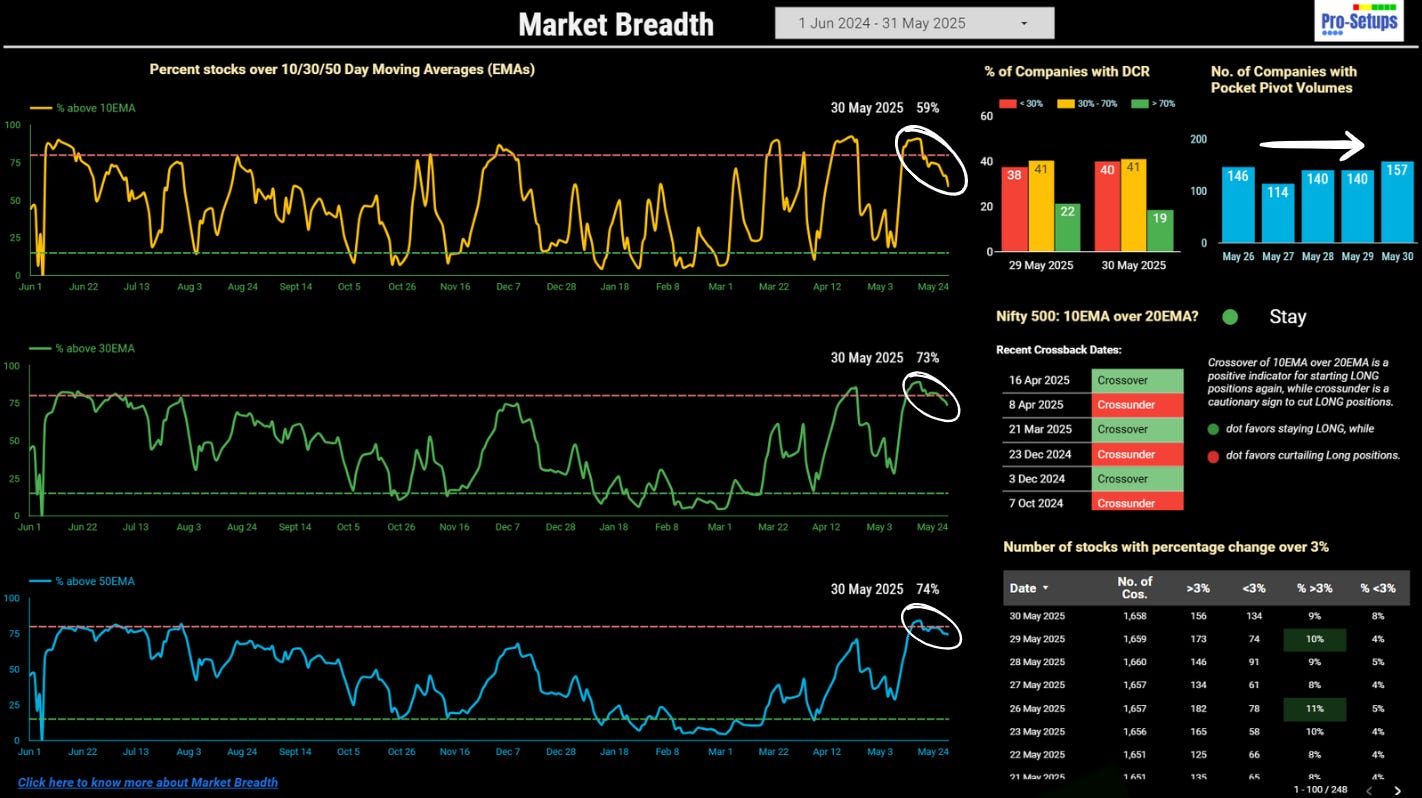
The fact that a higher percentage of stocks remain above their 30EMA and 50EMA, compared to the 10EMA, indicates underlying strength in the broader market trend, despite some short-term consolidation. Over the past two weeks, the market has been digesting the gains achieved up to the second week of May. As highlighted in previous newsletters, market breadth had reached overbought levels - a condition that is typically succeeded by a phase of pause, consolidation, sectoral rotation or a mild pullback. It’s important to note that overbought or oversold signals are most relevant for swing traders, as they reflect short-term momentum shifts. Positional traders, meanwhile, should use these periods to look for opportunities to add to strong existing positions, rather than treating these signals as cues for immediate action.
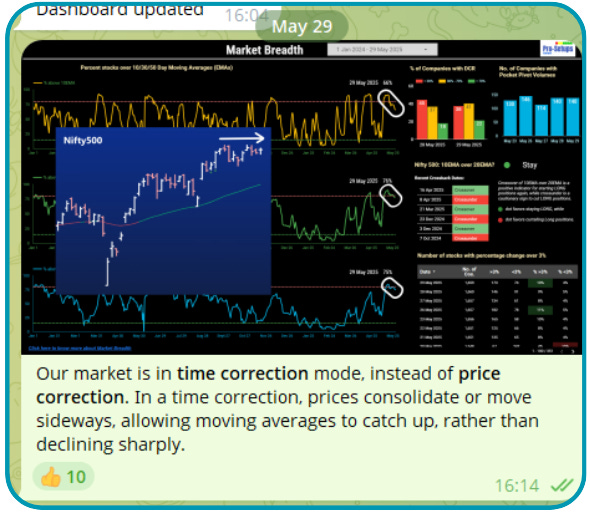
Our market is in more of a time correction mode, instead of price correction. In a time correction, prices consolidate or move sideways, allowing moving averages to catch up, rather than declining sharply. This was discussed in our Discussion Group during the week as well. If benchmark indices have remained largely flat over the week but the percentage of stocks above key EMAs is declining, this typically indicates a time correction rather than a price correction.
Understanding Time Correction
Time correction occurs when the market or a stock consolidates sideways within a narrow range for an extended period, rather than undergoing a sharp decline. Prices do not move significantly up or down, but the market spends time digesting previous gains. Individual stocks may gradually slip below their moving averages due to lack of upward momentum, even though the indices themselves remain stable.
This phenomenon often arises after a strong rally, when valuations have run ahead of fundamentals or when there is a lack of fresh triggers (Can Rate Cut be that trigger?). Instead of a sharp drop (price correction), the market works off its overbought condition through sideways movement.
What Can One Infer from Time Correction in a Bullish Trend?
In a bullish overall trend, time corrections are generally healthy. They allow market excesses to be worked off without causing panic or sharp drawdowns. During a primary bull market, time corrections can allow investor psychology to chill out. Once time correction run its course, the primary trend can resume again. Time corrections can test patience, as portfolios may show little or no growth. However, it is of concern only for swing traders whereas positional traders or long-term investors who stay invested often benefit when the primary uptrend resumes.
Conclusion
In a bullish market, time correction is a constructive phase that allows the market to consolidate gains, and set up for the next advance. Investors should remain patient, as time corrections are often followed by renewed upward momentum once the consolidation phase ends.