
Higher Timeframe, Higher Confidence: Align Your Trades with the Market
Most losing trades come from ignoring the higher timeframe trend. See how reading the bigger picture helps you trade with conviction. Pro-Setups brings this power straight to your charts and scans!

Picture this: You spot what looks like a perfect breakout on your daily chart, enter the trade with confidence, only to watch it reverse and hit your stop-loss the next day. Your ‘perfect’ breakout has failed, and you are staring at a loss that could have been easily avoided.
While you were focused on that daily chart breakout, the weekly chart might have been screaming a completely different story. Perhaps the stock was hitting a major resistance level that was holding for months, or maybe it was in the middle of a strong downtrend that your daily chart simply could not reveal.
This is the costly mistake of trading and it is exactly why successful traders always check higher timeframes before pulling the trigger on any trade. A stock may look tempting on the daily chart, but if the broader trend is pointing the other way, that trade can quickly turn into a loss. When you align your trades with the higher timeframe trend, you are swimming with the current.
You must have heard many quotes on trend following such as “The trend is your friend until it ends”, or “Do not fight the trend”. Half of the battle is won if you can identify the underlying trend. And that's impossible to do if you are only looking at one timeframe.
In this post, you will explore why higher timeframe trends matter for traders. You will also see how Pro-Setups simplifies this analysis by displaying both higher and current timeframe trends on your charts, plus provides scans to find the right trading opportunities.
What Is Meant by “Higher Timeframe”?
Simply put, a higher timeframe gives you a zoomed-out view of what the stock is really doing.
If you usually trade on a daily chart, your higher timeframe could be the weekly chart.
If you trade on an hourly chart, the daily chart becomes your higher timeframe.
If you scalp on 15-minute charts, then hourly and daily charts serve as your higher timeframes.
Why Higher Timeframe Analysis Matters
Helps you avoid counter-trend trades: Many traders lose money because they get trapped trading against the main trend. A strong rally on the weekly chart means dips on the daily are often buying opportunities, not reasons to short.
Cuts through false signals: Lower timeframes are notorious for generating misleading signals. A stock might appear to be breaking out on a daily chart, but if the weekly chart is in a strong downtrend, that breakout has a very strong probability of failing.
Boosts your win rate: When the smaller timeframe setup aligns with the higher timeframe trend, your trade has a better chance of working out.
For example, imagine you enter a BUY trade based on a daily uptrend, and the weekly timeframe also shows an uptrend. This alignment gives you much more confidence, doesn’t it?
On the other hand, if you enter a BUY trade based on a daily uptrend while the weekly timeframe shows a downtrend, you need to be cautious because the trend on a daily timeframe might reverse, quickly triggering your stop-loss.
Using Higher Timeframe Trends in Trading
Now that you understand the importance of higher timeframe analysis, let’s get onto a simple step-by-step approach to do it:
Start with the Bigger Picture
Start by opening your weekly chart and identifying the main trend: Is it up, down, or sideways? Mark key support and resistance zones.
Narrow Down to Your Trading Timeframe
Now switch to your daily chart and look for setups that align with the weekly trend. For example, if the weekly trend is up, look for breakouts or pullbacks to buy on the daily timeframe.
Align the Two Views
Before you pull the trigger, double-check that your daily setup aligns with the broader weekly direction. Trading against the higher timeframe usually reduces your chances of success.
Plan Entries and Exits
Use the daily chart or a lower timeframe such as 75-minutes or 125-minutes charts to plan your entries, stop-loss, and profit-booking levels. The weekly chart gives the direction, but the daily chart provides the timing.
This process sounds straightforward, right? And it is, but only if you avoid these common traps that catch even experienced traders:
Common Mistakes to Avoid
Ignoring the higher timeframe altogether - jumping into trades based only on daily timeframe setups without checking weekly trends. Now, this usually happens when the FOMO kicks in, and checking the weekly chart feels like unnecessary delay that might cost you the trade. Make it a rule to spend just 30 seconds checking the higher timeframe before entering a trade.
Fighting the Higher Timeframe Trend - Taking counter-trend trades because "the stock looks oversold" or "it is due for a bounce". As a trader, you do not have to be the smart money buying the dip when everyone is bearish. The brutal reality is that counter-trend trading is like trying to catch a falling knife, you might catch one or two, but in most cases, it will only harm you. The fix is to accept that trends can last longer than you expect. If the weekly chart shows a clear downtrend, either stay out or look for shorting opportunities instead of trying to catch falling knives.
Overcomplicating things - Keep it simple. The higher timeframe should provide clarity, not confusion. You do not need to check every timeframe. One higher timeframe is usually enough. If you are scanning & trading based on daily timeframe, checking weekly timeframe trend is enough.
Now, you must be thinking: “This all sounds great, but manually checking multiple timeframes for every potential trade is time-consuming.” You're absolutely right, and that’s exactly where Pro-Setups can help you immensely.
How can Pro-Setups Help You
The Pro-Setups indicator on TradingView makes the whole process ridiculously simple with easy-to-read colored bars at the top of your charts. Think of these bars as traffic lights that instantly tell you whether you are trading with or against the underlying trend.
The green bars represent the area where the Uptrend is strong and favors buying opportunities, while the red bars mean strong Downtrend and favors shorting opportunities. The yellow bars imply a changing trend or sideways direction.
The indicator shows you two trend bars that work together to give you a complete picture:
Top bar: Shows the trend from weekly timeframe (higher timeframe giving you a bigger picture).
Bottom bar: Shows the trend on daily timeframe.
On a daily timeframe, the first bar represents the weekly trend direction, while the second bar represents daily trend direction.
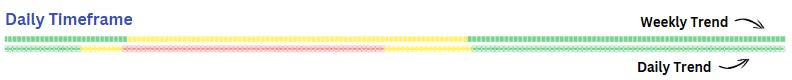
On a weekly timeframe chart, both the trend bars represent weekly trends, , so they will show the same color.
These trend bars are not plotted on any timeframe lower than Daily, thereby keeping your analysis focused on meaningful trends.
To make sure that you only check the stocks with strong uptrend, the Pro-Setups Dashboard has a filter for scanning the stocks that are in Uptrend, Downtrend or moving Sideways. This saves you hours of manually checking multiple charts.


Example
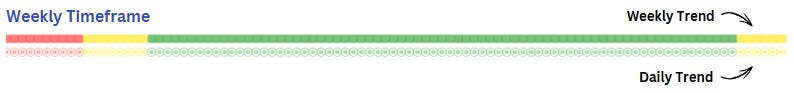
Picture this: You spot what looks like a perfect Volatility Compression Pattern (VCP) forming on your daily chart. You buy with confidence, only to watch it fail and hit your stop-loss.
What went wrong? You focused only on the daily chart pattern without checking the bigger picture.
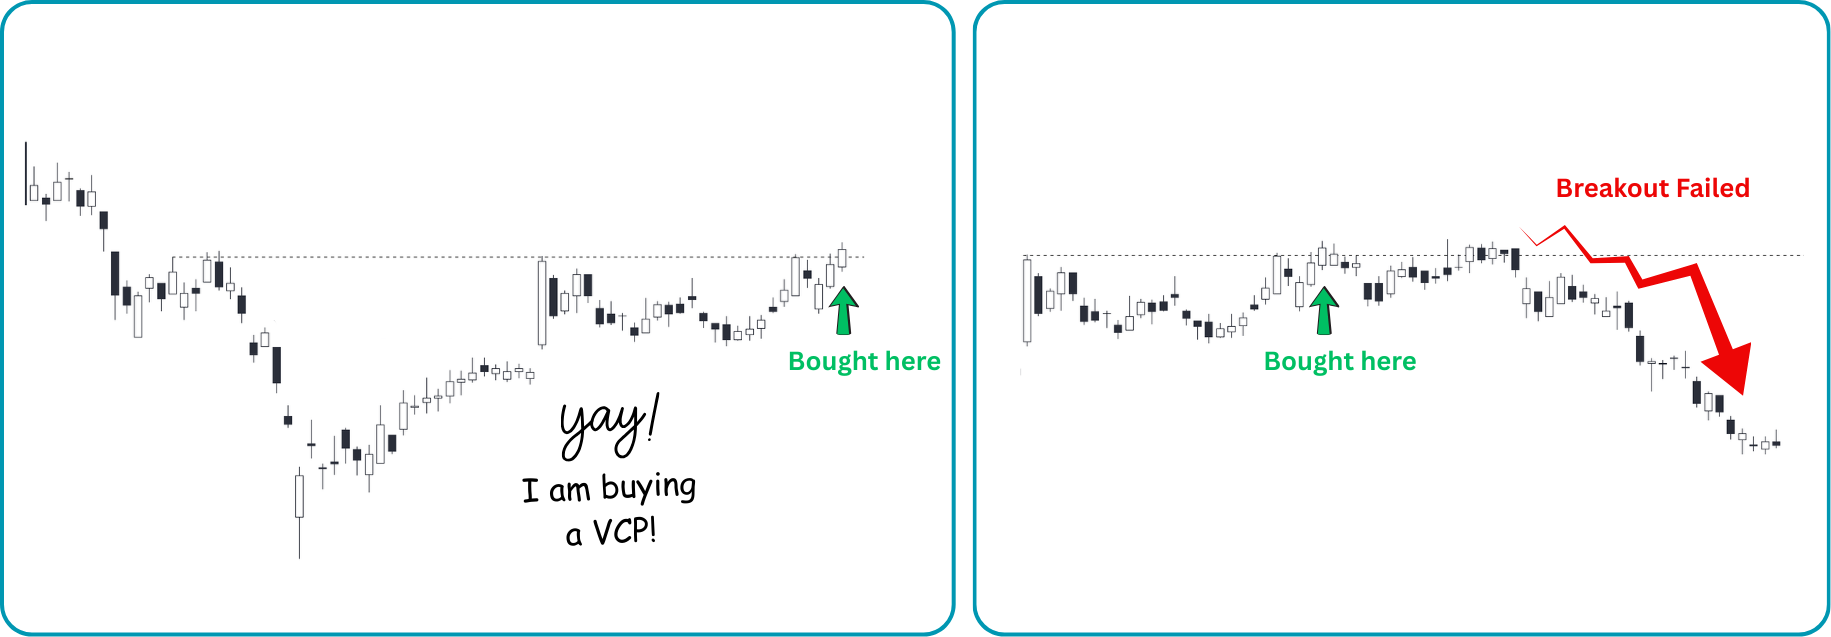
Now, if you had zoomed out the chart, you would have noticed that the stock was already in a downtrend on higher timeframe, even though the current timeframe trend was up! Your ‘perfect’ VCP was actually just a pause in a larger selloff.

With the Pro-Setups indicator on your charts, spotting higher timeframe trends becomes effortless. Those colored trend bars at the top of your chart would have immediately shown you red bars (downtrend) on the weekly timeframe, saving you from this costly trade.
Even Better with the Dashboard: Instead of manually hunting through hundreds of charts, simply scan for stocks with green weekly trend bars (uptrends).
Then layer on additional filters like:
High Relative Strength stocks and sectors
Proven setups (VCP, Bull Flags, Power Plays)
Strong financials with Easy Earnings Comparison
The Result? You get a curated list of stocks where both the setup AND the higher timeframe trend are working in your favor - dramatically improving your odds of success.
Key Takeaway
Here's the bottom line: understanding higher timeframe trends will make you a more confident trader with fewer false starts. By aligning with the bigger market forces, you improve your chances of consistent profitability.
To put this into practice, start small. Add just one higher timeframe to your analysis. For example, if you trade on the daily chart, check the weekly chart before acting. Over time, you will naturally spot how the broader trend guides your setups.
So, the next time a daily signal tempts you, pause and ask: “What does the higher timeframe say?” Often, that one question can save you from a losing trade and guide you toward a winning one.
Want to make this even easier? Let Pro-Setups do the heavy lifting instead of you manually checking multiple timeframes. Its colored trend bars instantly show you both higher timeframe and current timeframe trends at a glance, while the dashboard helps you quickly scan for stocks moving in your favor.