
Market Sense as on 12th Feb 2023

Market Breadth
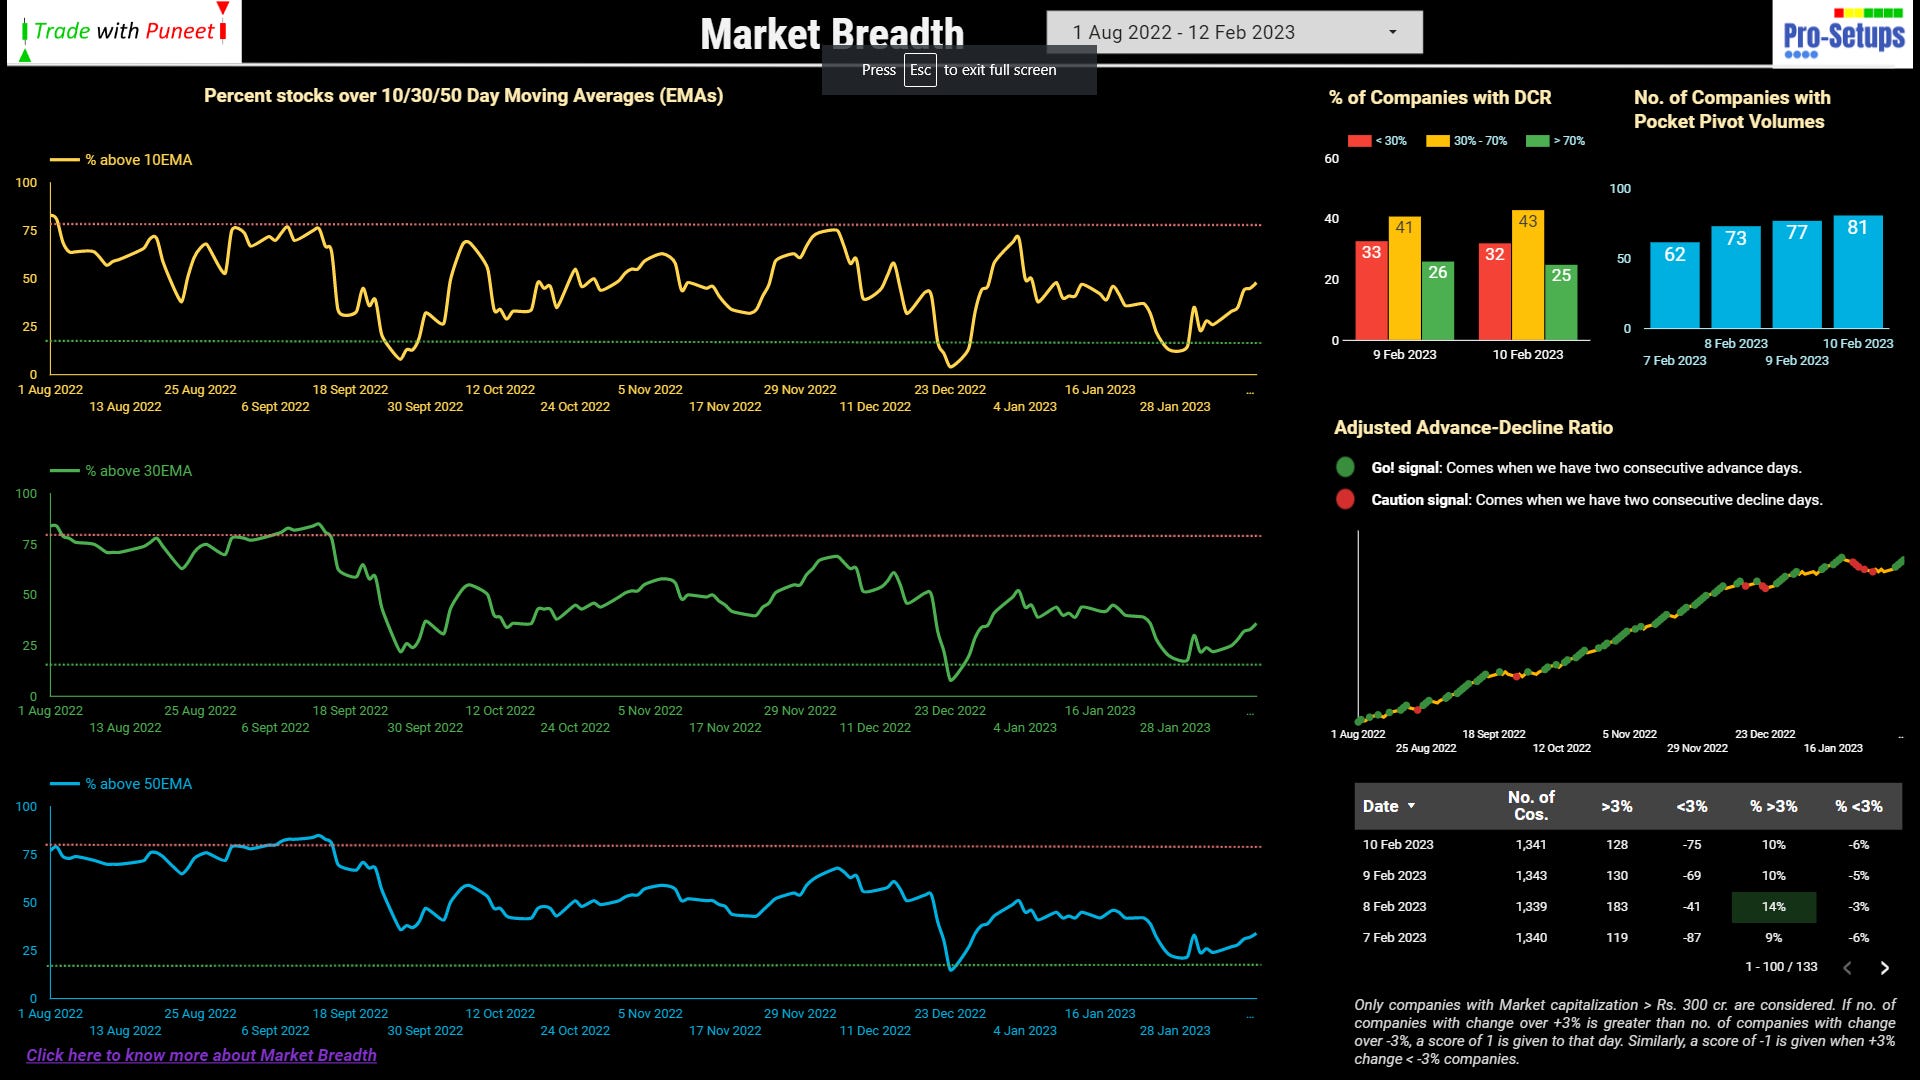
We are on road to recovery from January’s last week sell off. The percentage of stocks above key short-term moving averages are inching up gradually. The number of stocks with pocket pivot volume candles are also gaining traction.
Nifty 500 Weekly Chart
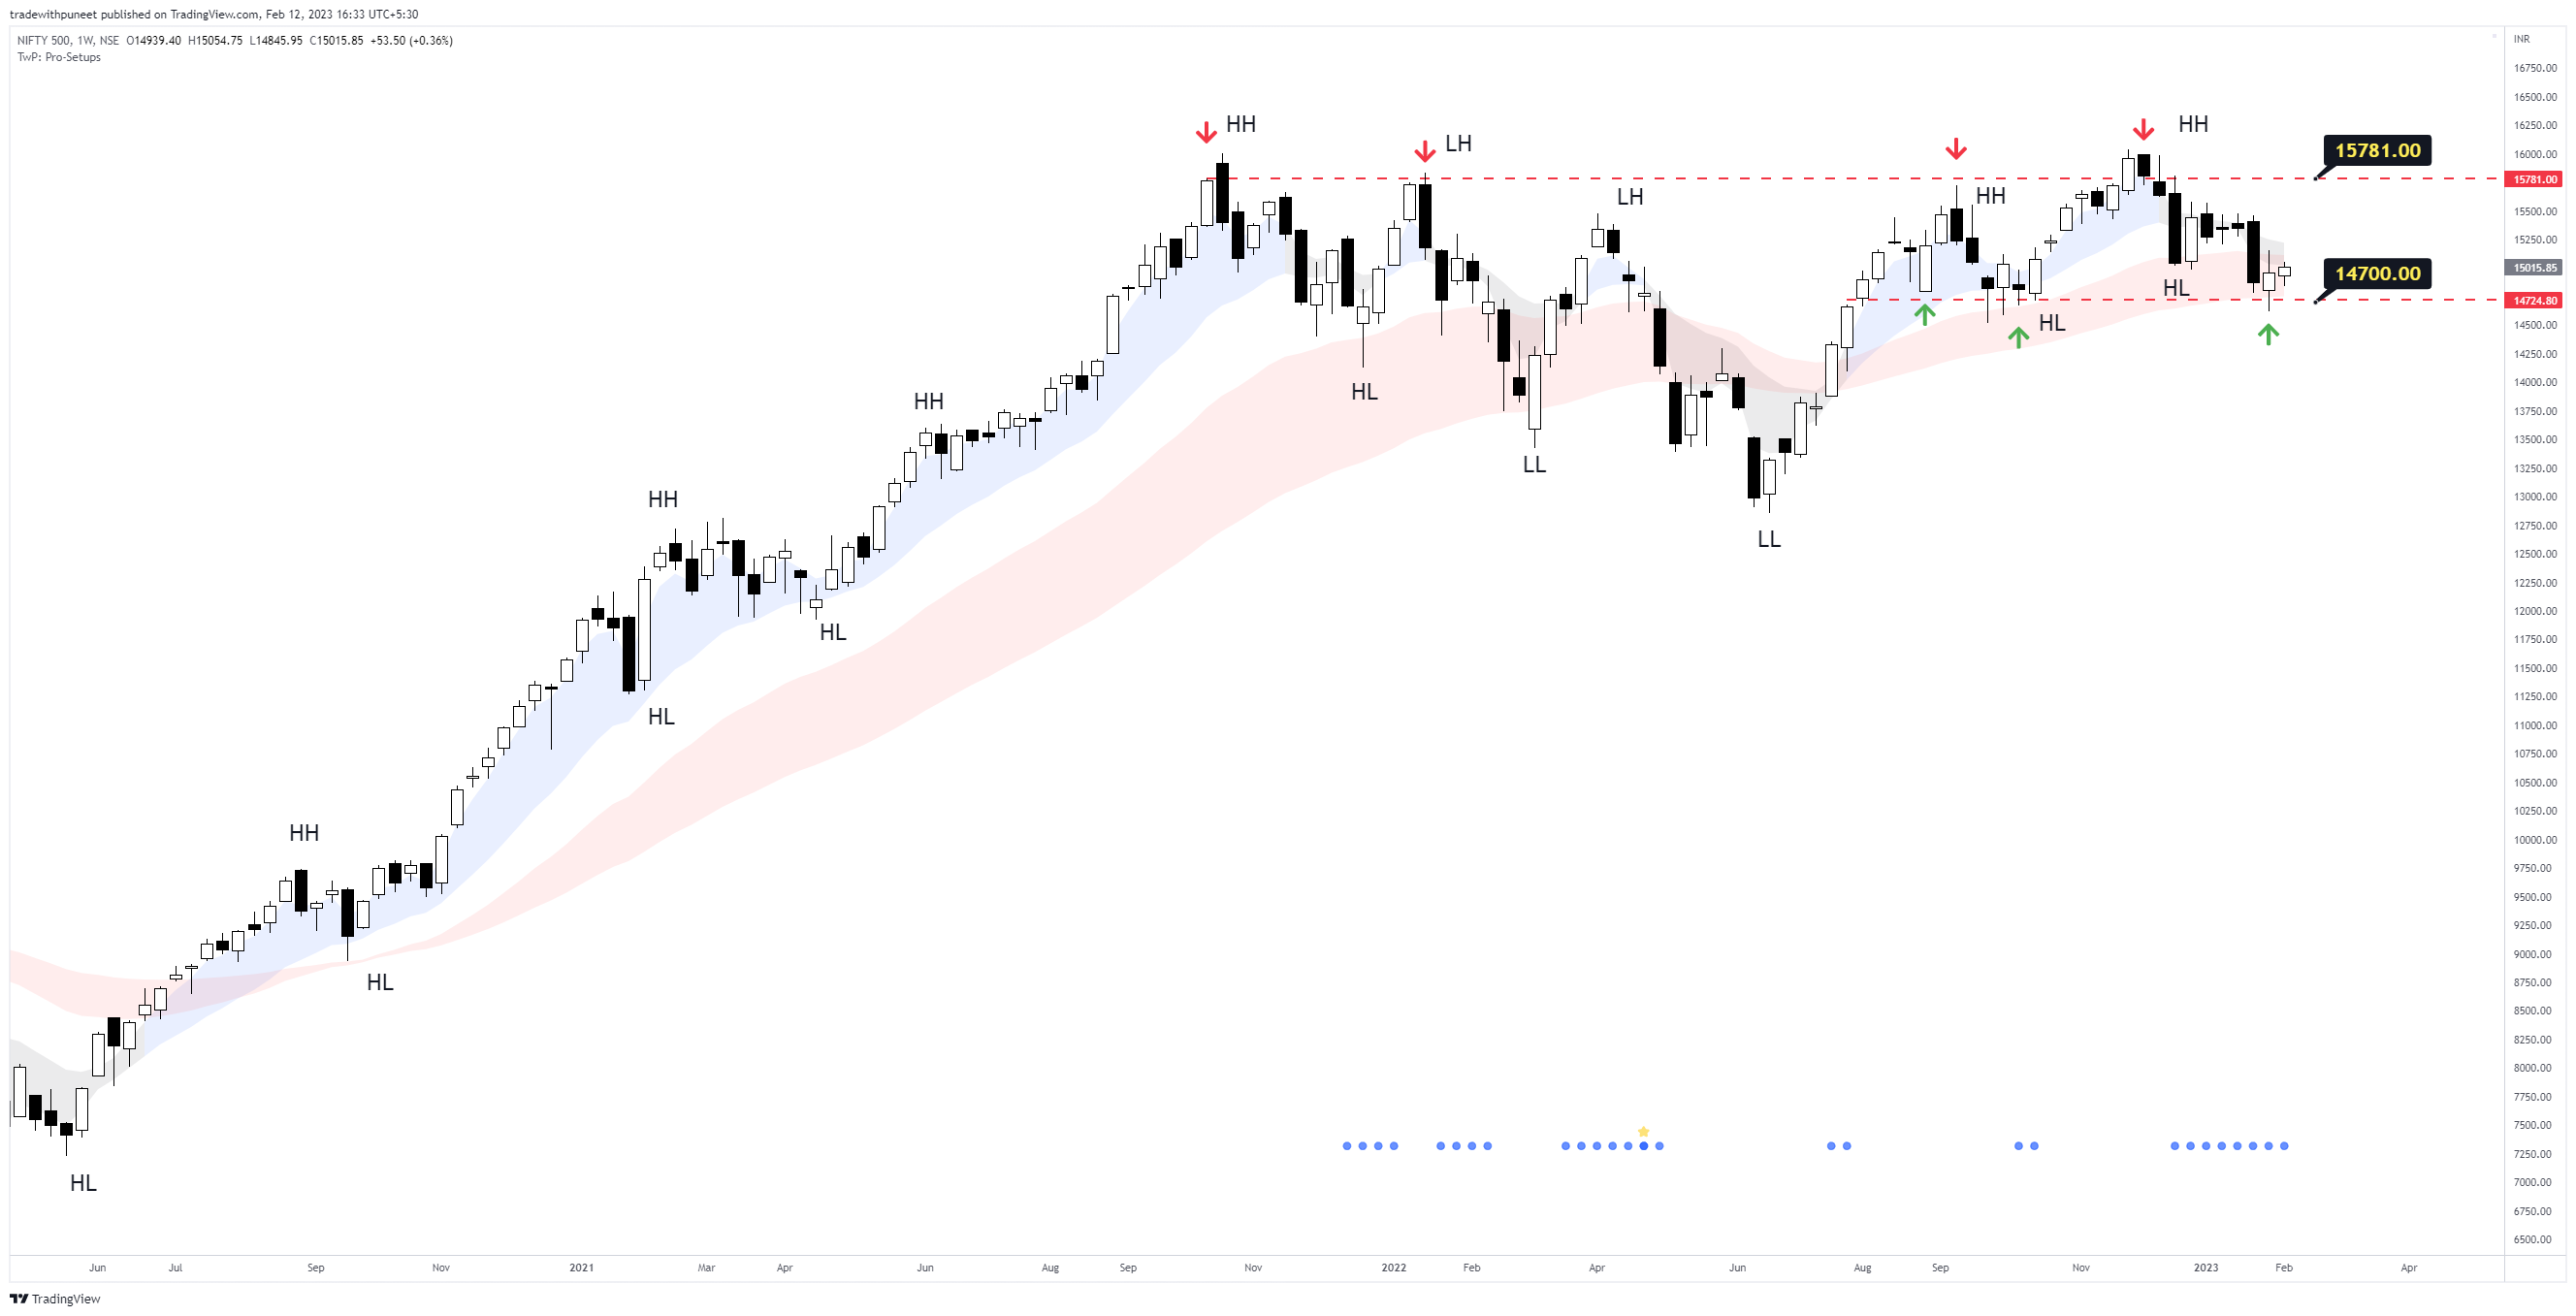
We are bouncing off from the support zone. We had a positive white candle for the week, albeit rather small. But it is still important, because it is coming near the support zone. The last week’s candle was also an inside bar. It is important for us to move upwards now. We are still in a sell-on-rise market and any further fall will be a signal to quickly close open positions. On charts, the weekly Nifty500 chart also looks like an Inverted H&S pattern after an uptrend.
We should be able to take the high of the previous week’s (23rd Jan) black candle convincingly for a good run upwards. (Just to recall - we were not able to breach the high of 19th Dec weekly candle for over 3-4 weeks, and what followed was 23rd Jan black weekly candle.)
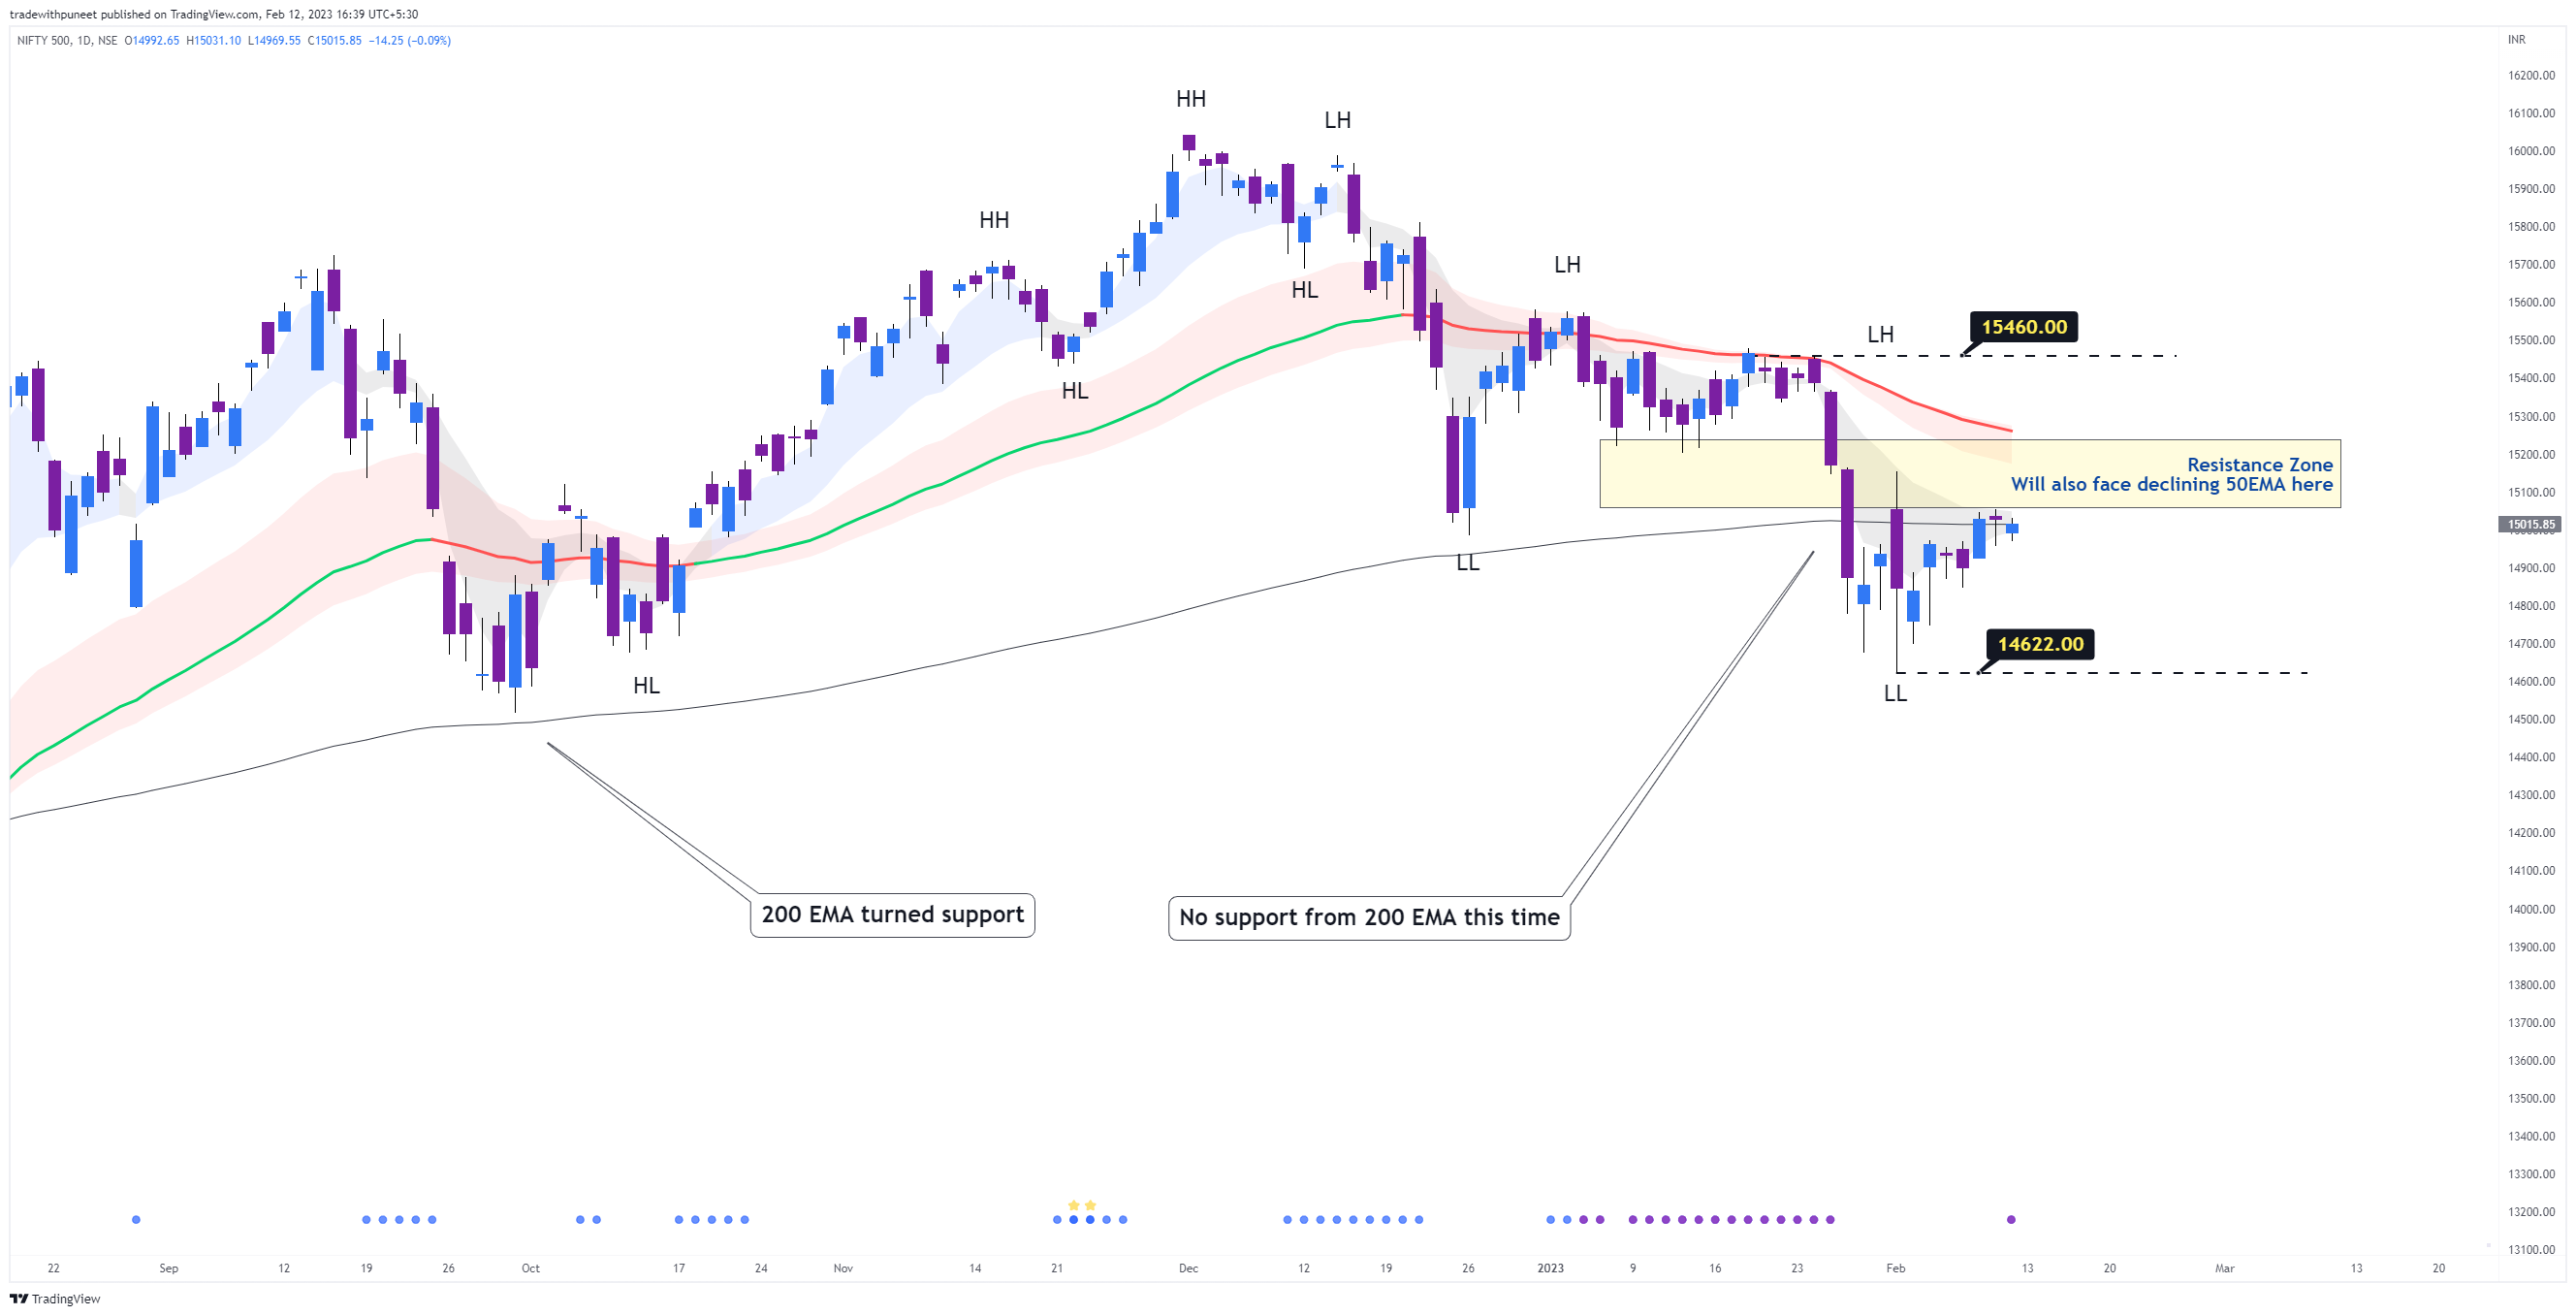
We are sitting on 200EMA. Once we are able to reclaim the 200EMA, the immediate resistance will be the declining 50EMA. These are not magic lines, but they’re important because traders worldwide scan and take action based on these lines. Once that is also done, we should be comfortably breaking the previous lower high of 15460.
Conclusion: No change since last couple of days. It’s time to get into longs, though cautiously. Recently announced quarterly financials + Relative Strength must be checked in order to not enter into those stocks which are already weak. Strategy remains same - have lesser number of open positions since market structure is still weak. We have only seen a couple of days of bounce, with small white candles, and one cannot rule out a further fall from here.
Current exposure - 59% invested, with 6 open positions.