
Market Sense as on 13th Feb 2023

Market Breadth
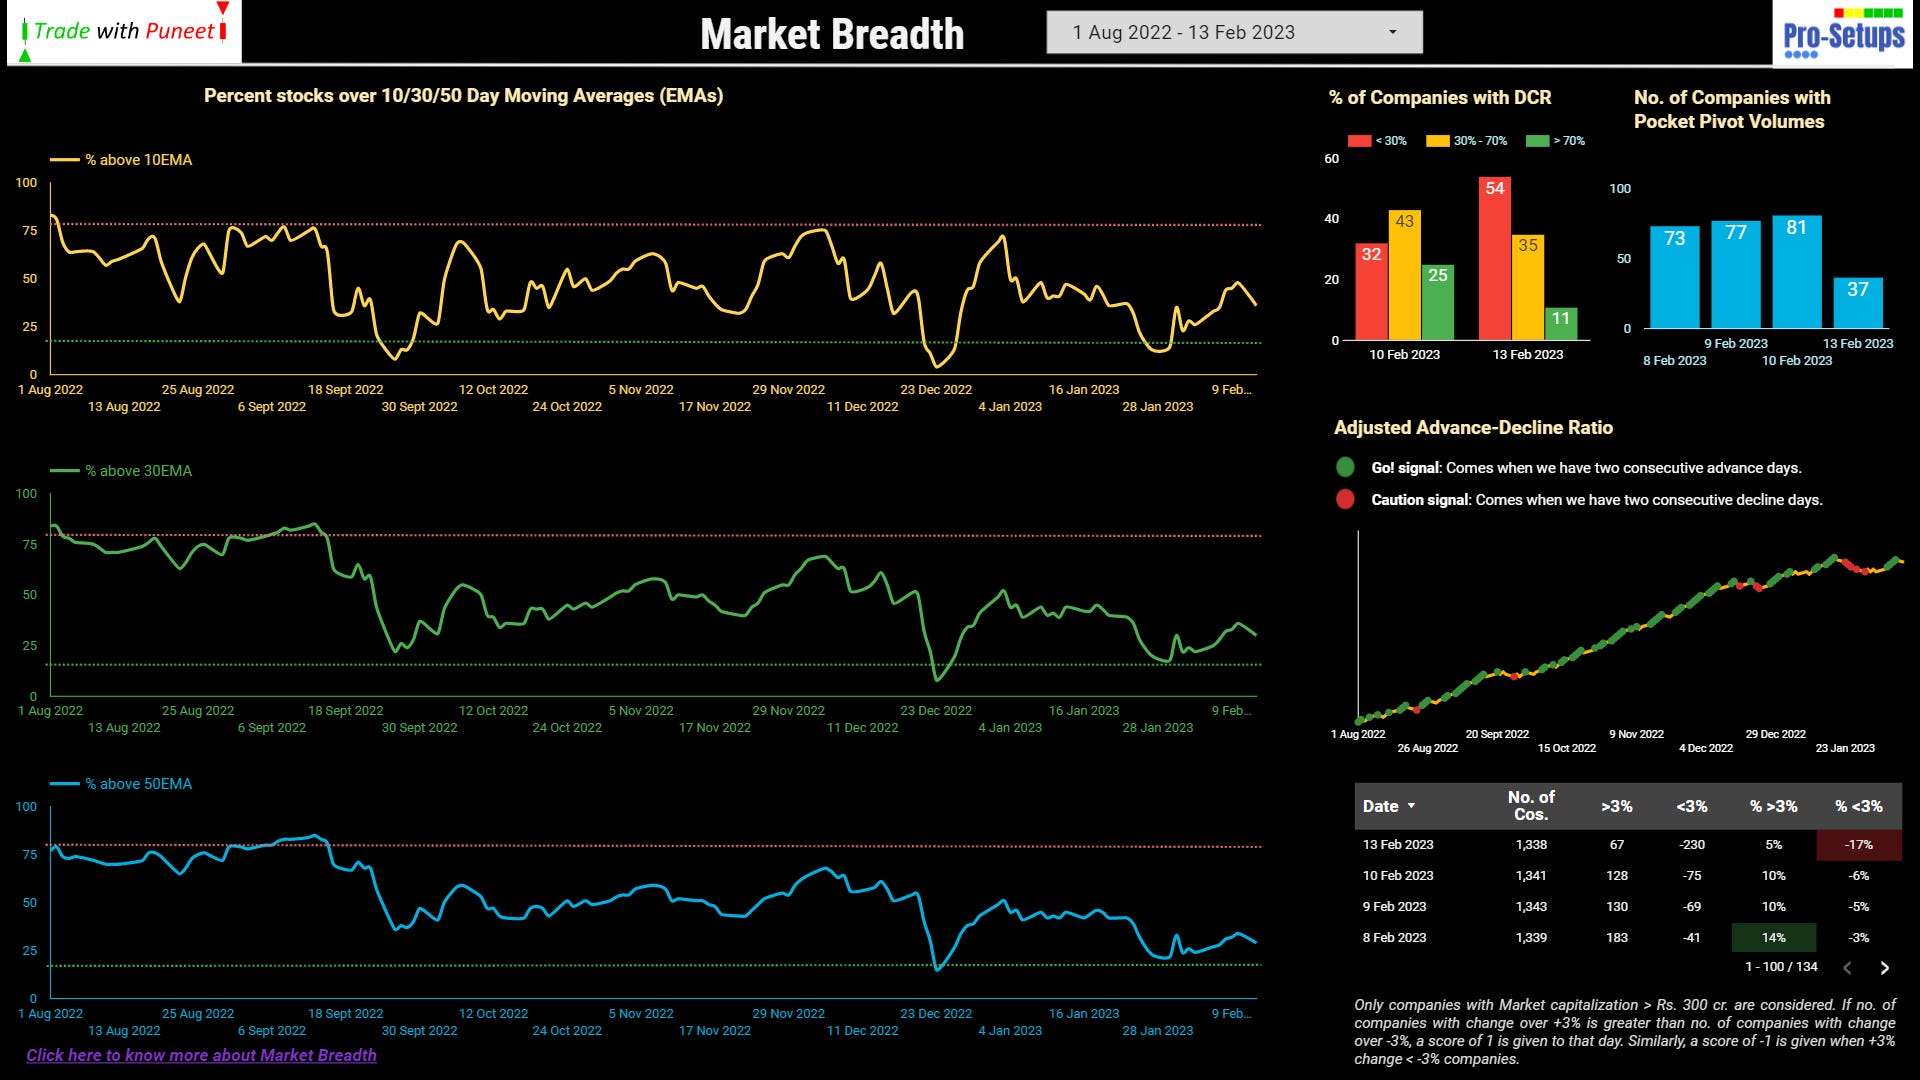
Sharp drop in the number of stocks giving pocket pivot volume candles. The % of stocks above key short-term moving averages are inching up, although there seems to be a pause again. We are probably in a stage, where traders with tight stop losses will have to cut their position.
Nifty 500 Weekly Chart
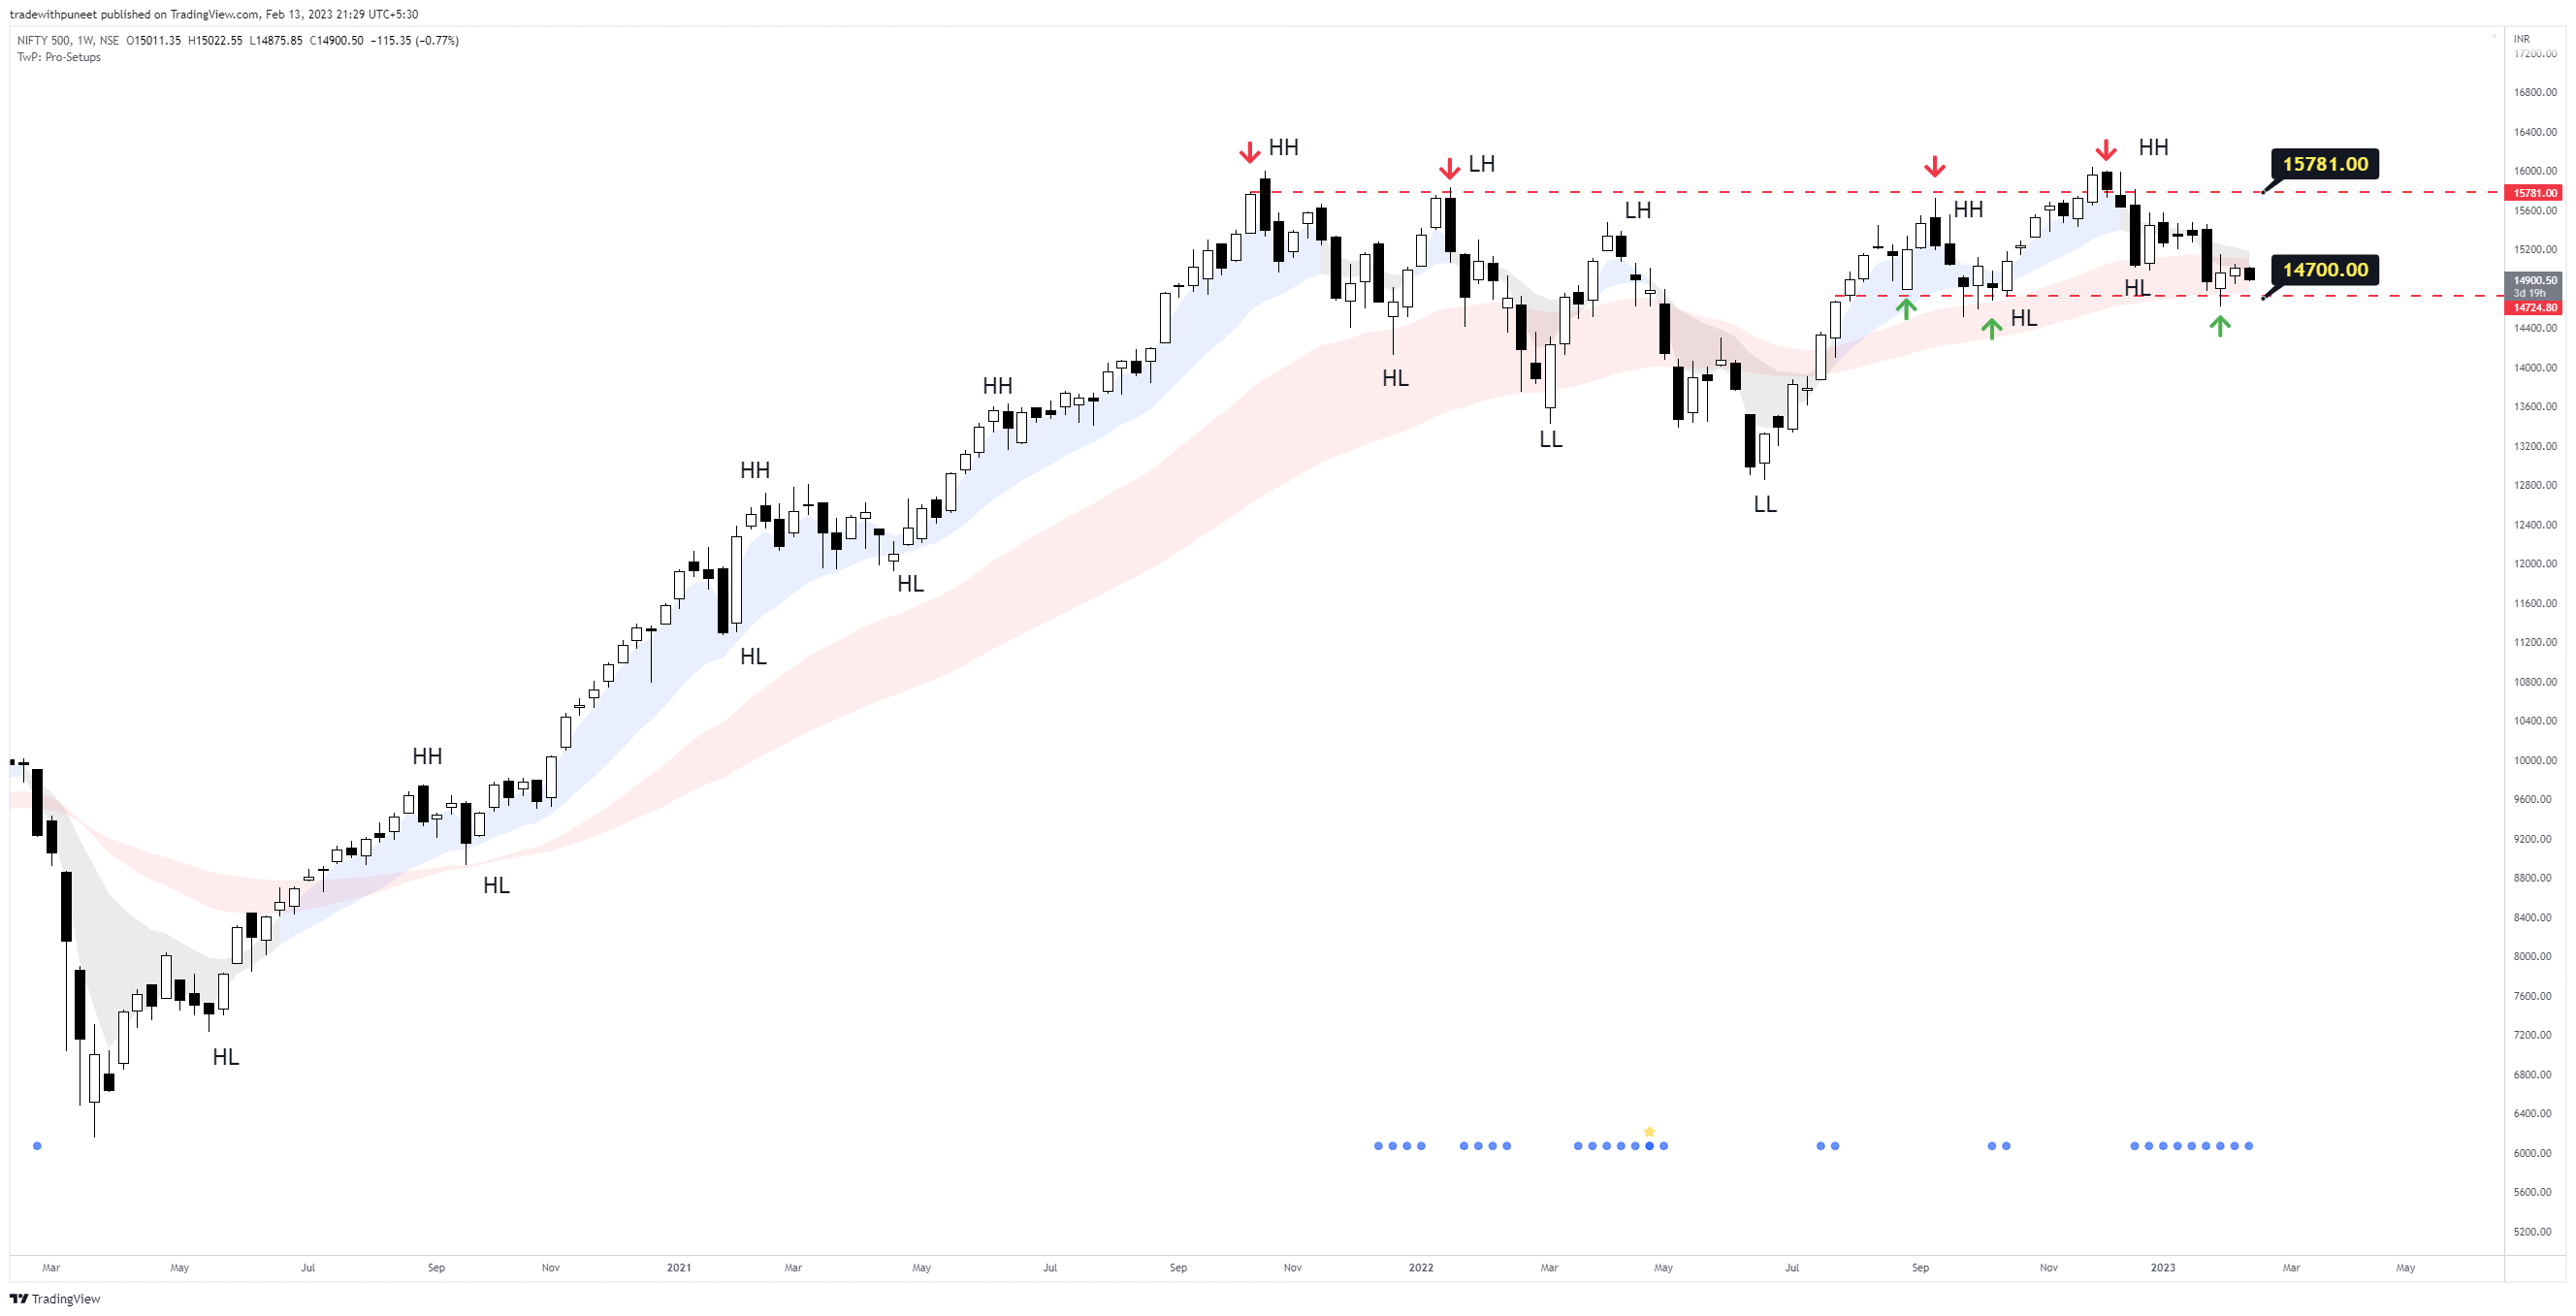
We are bouncing off from the support zone. We had a positive white candle for the last week, albeit rather small. But it is still important, because it is coming near the support zone. The last week’s candle was also an inside bar. The current week has started on a wrong foot, with a full body black candle.
We are still in a sell-on-rise market and any further fall will be a signal to quickly close open positions. On charts, the weekly Nifty500 chart continues to look like an Inverted H&S pattern after an uptrend.
We should be able to take the high of the previous week’s (23rd Jan) black candle convincingly for a good run upwards. (Just to recall - we were not able to breach the high of 19th Dec weekly candle for over 3-4 weeks, and what followed was 23rd Jan black weekly candle.)
Nifty 500 Daily Chart
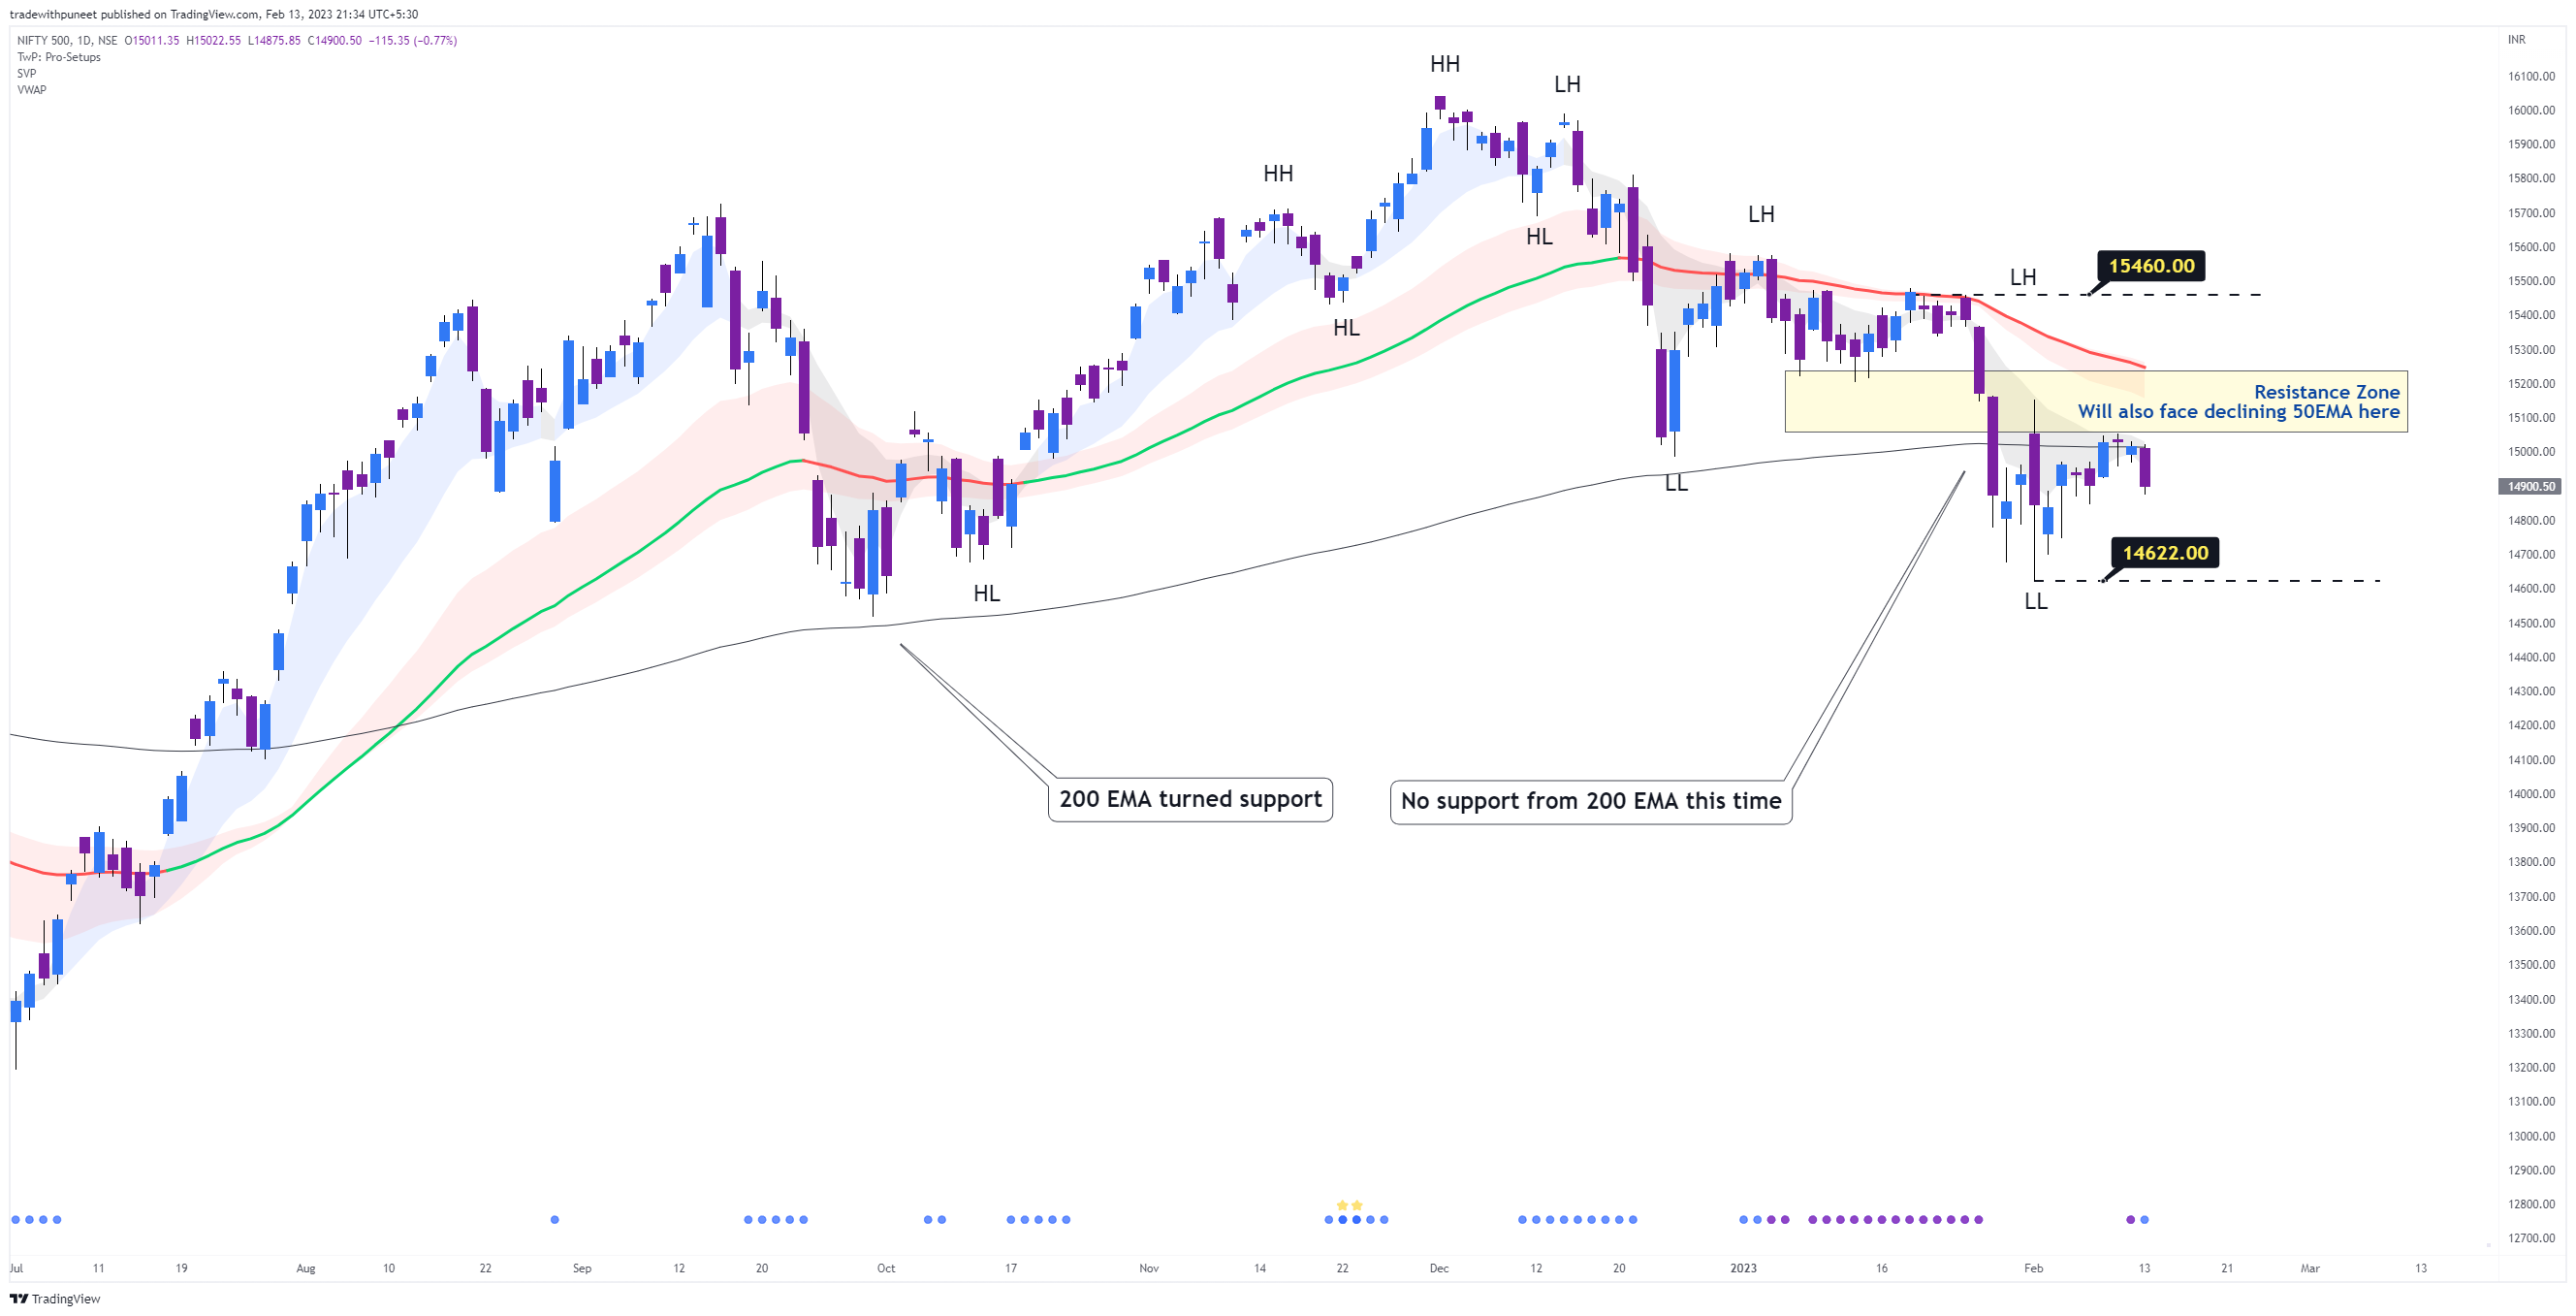
Forget about a date with 50EMA, even an affair with 200EMA is turning out to be a bad one. Even the budget day candle is getting hard to be taken over. We have started to fall, without even reaching the resistance zone. If we fall tomorrow, it will surely hit stop losses.
Conclusion: Negative change since yesterday. It’s time to save whatever little profits were made in February and exit longs once stop losses trigger. A positive candle is likely to face further selling.