
Market Sense as on 15th Feb 2023

Market Breadth

Market breadth works best when all three percentage lines are in their extreme zones. At present, we’re neither in an extreme oversold not extreme overbought territory. But given the last touch being the oversold territory, it makes more sense to assume that we need a bit of run up from here.
Nifty500
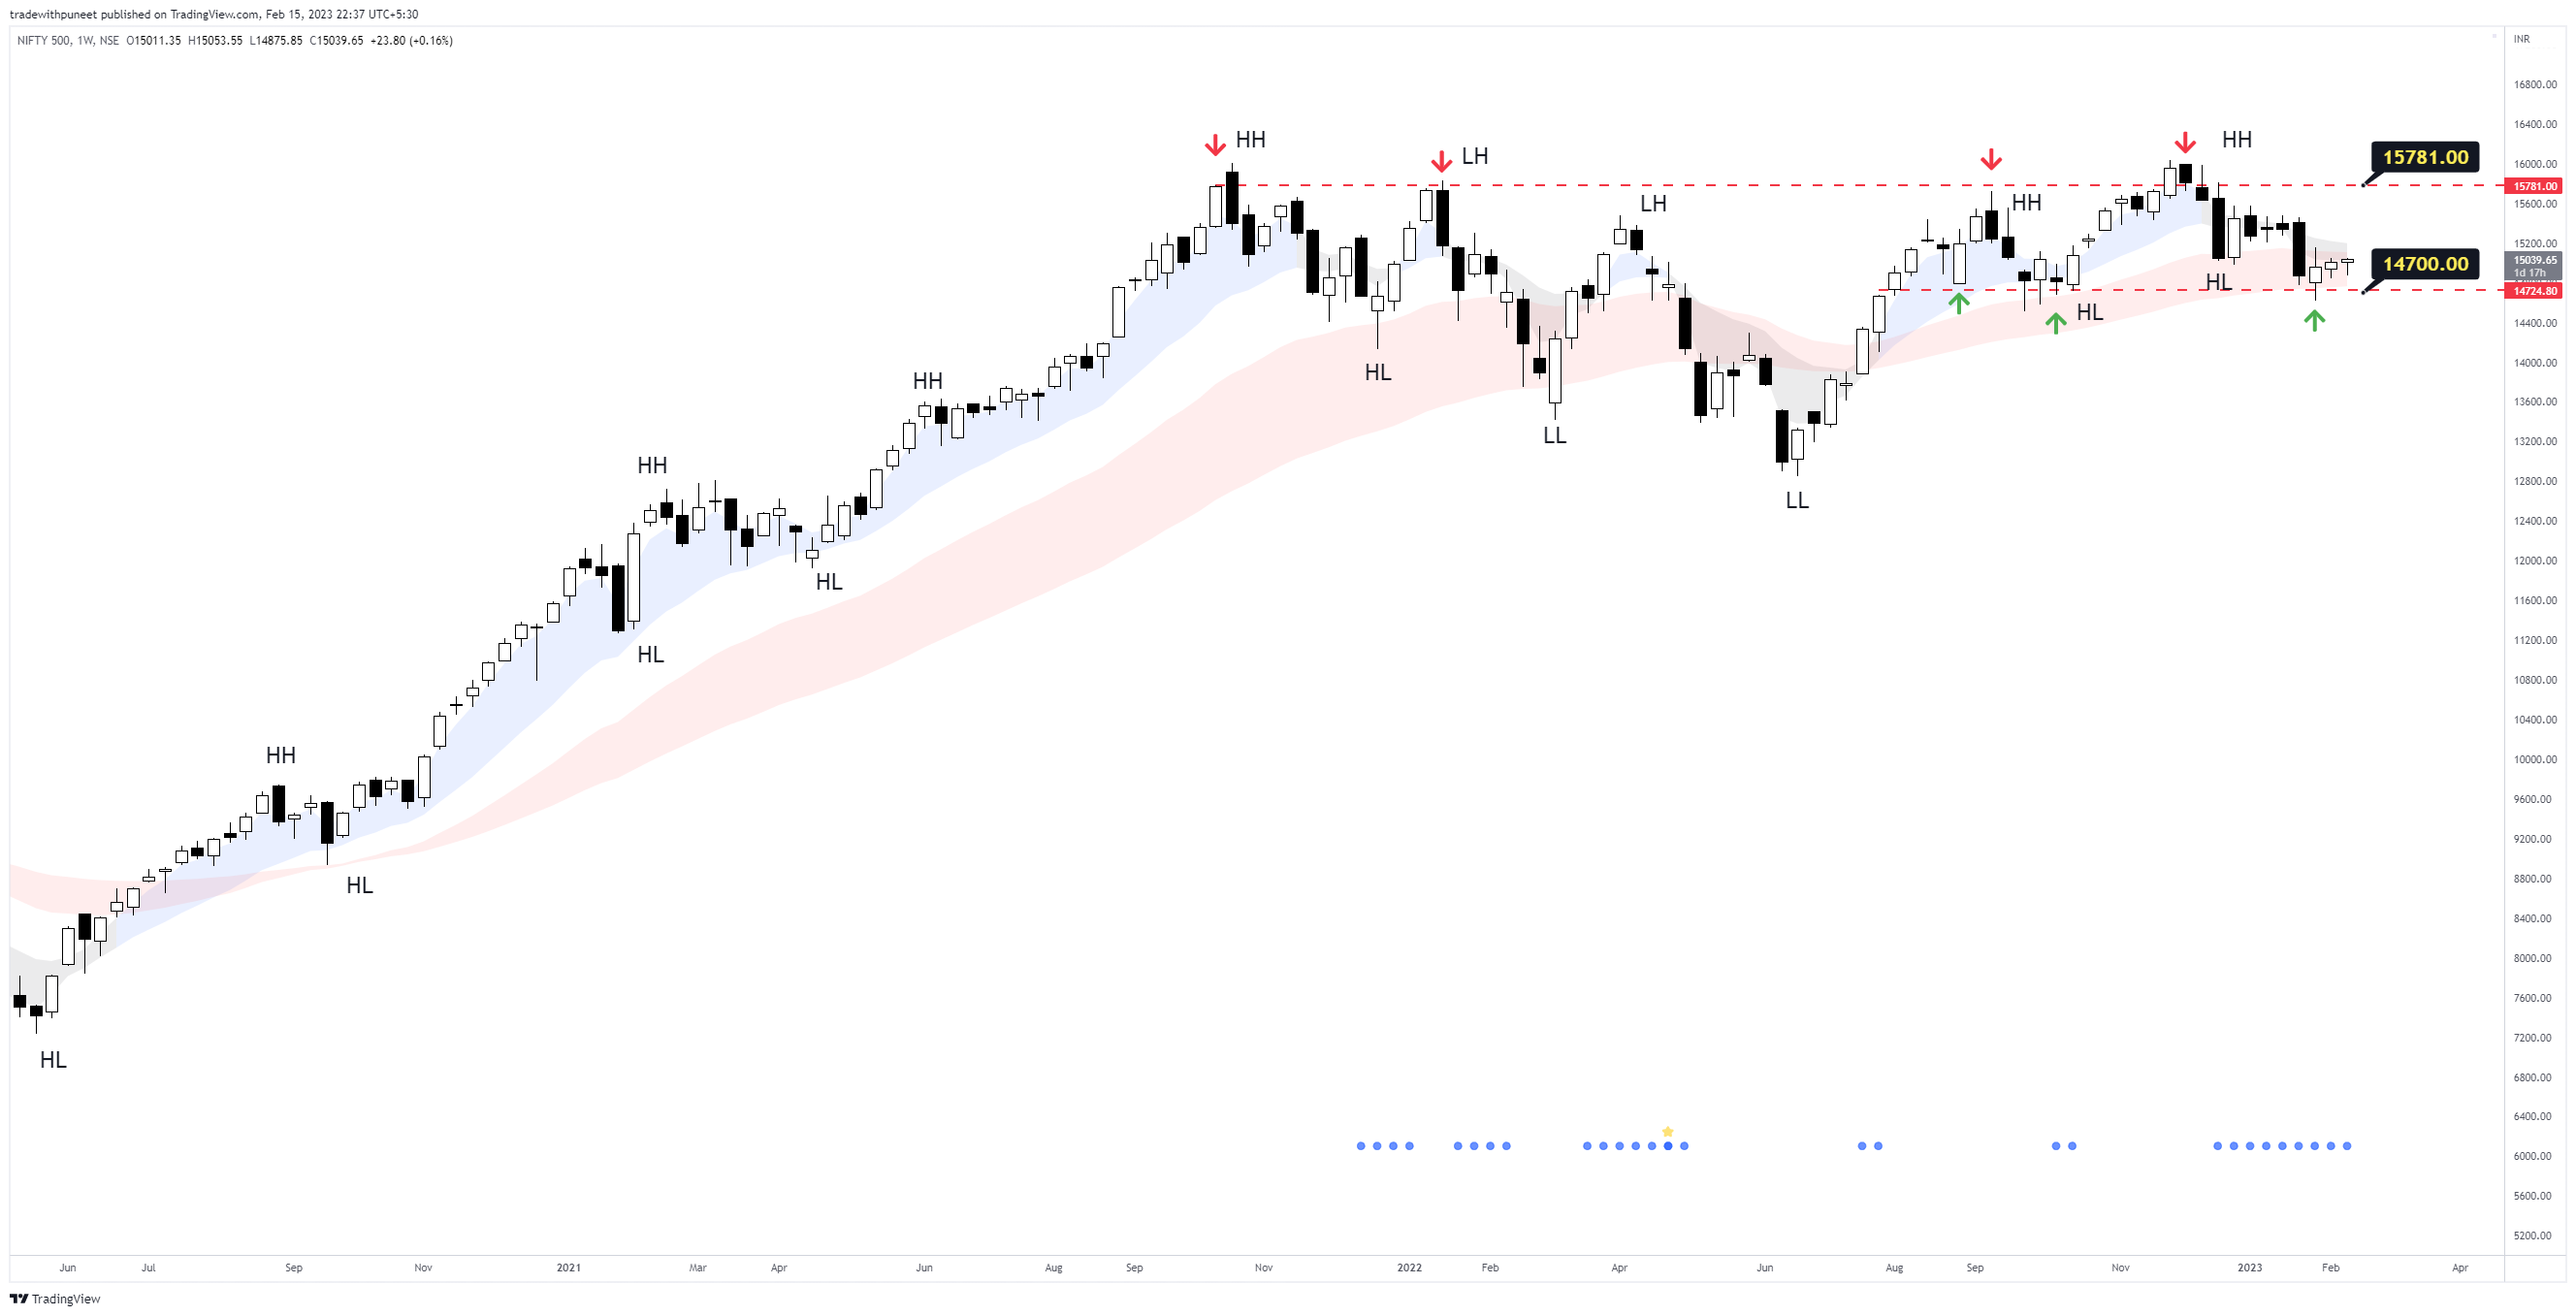
We are bouncing off from the support zone. Last week was a positive white candle, albeit rather small. But it is still important, because it came near the support zone. The current week started on a wrong foot, but has turned white so far. We now have two back-to-back insider bars on weekly chart.
We should be able to take the high of the previous week’s (23rd Jan) black candle convincingly for a good run upwards. (Just to recall - we were not able to breach the high of 19th Dec weekly candle for over 3-4 weeks, and what followed was 23rd Jan black weekly candle.)
On charts, the weekly Nifty500 chart continues to look like an Inverted H&S pattern after an uptrend. Breakout for a long run upwards is not near.

On Daily timeframe chart, we are dancing around 200EMA, with more white candles than black, which is positive. But I still believe that we can face resistance from declining 50EMA which is not far now. While Nifty managed to break the Budget day’s high and close above it and also its 50EMA, same is not true for Nifty500.
Conclusion: Positive change since last update. We have had two white candles and another attempt to recapture 200EMA. It is pivotal now to reclaim 50EMA also to call it a trending market. Till then, keep tight stops, and lesser expectations of higher gains. Take what market gives you and try not to give back to the market. Do not be overly bullish. We are still in a sell-on-rise market and any further fall will be a signal to quickly close open positions.
Current exposure - 55% invested, with 6 open positions.