
Market Sense as on 1st March 2023

Market Breadth

In my previous update of 22nd February, I mentioned that we are not yet in the oversold territory. It took few more days for the % of EMAs lines to reach the start of the oversold region on 27th Feb, and bounce off today with a good spike. Honestly, I was expecting a couple of days of more pain. But now it is important to have follow through days, else it will again be a dhokha to retail investors. For more information on how to use the market breadth page, you may check out this blog post: click here.
Nifty500
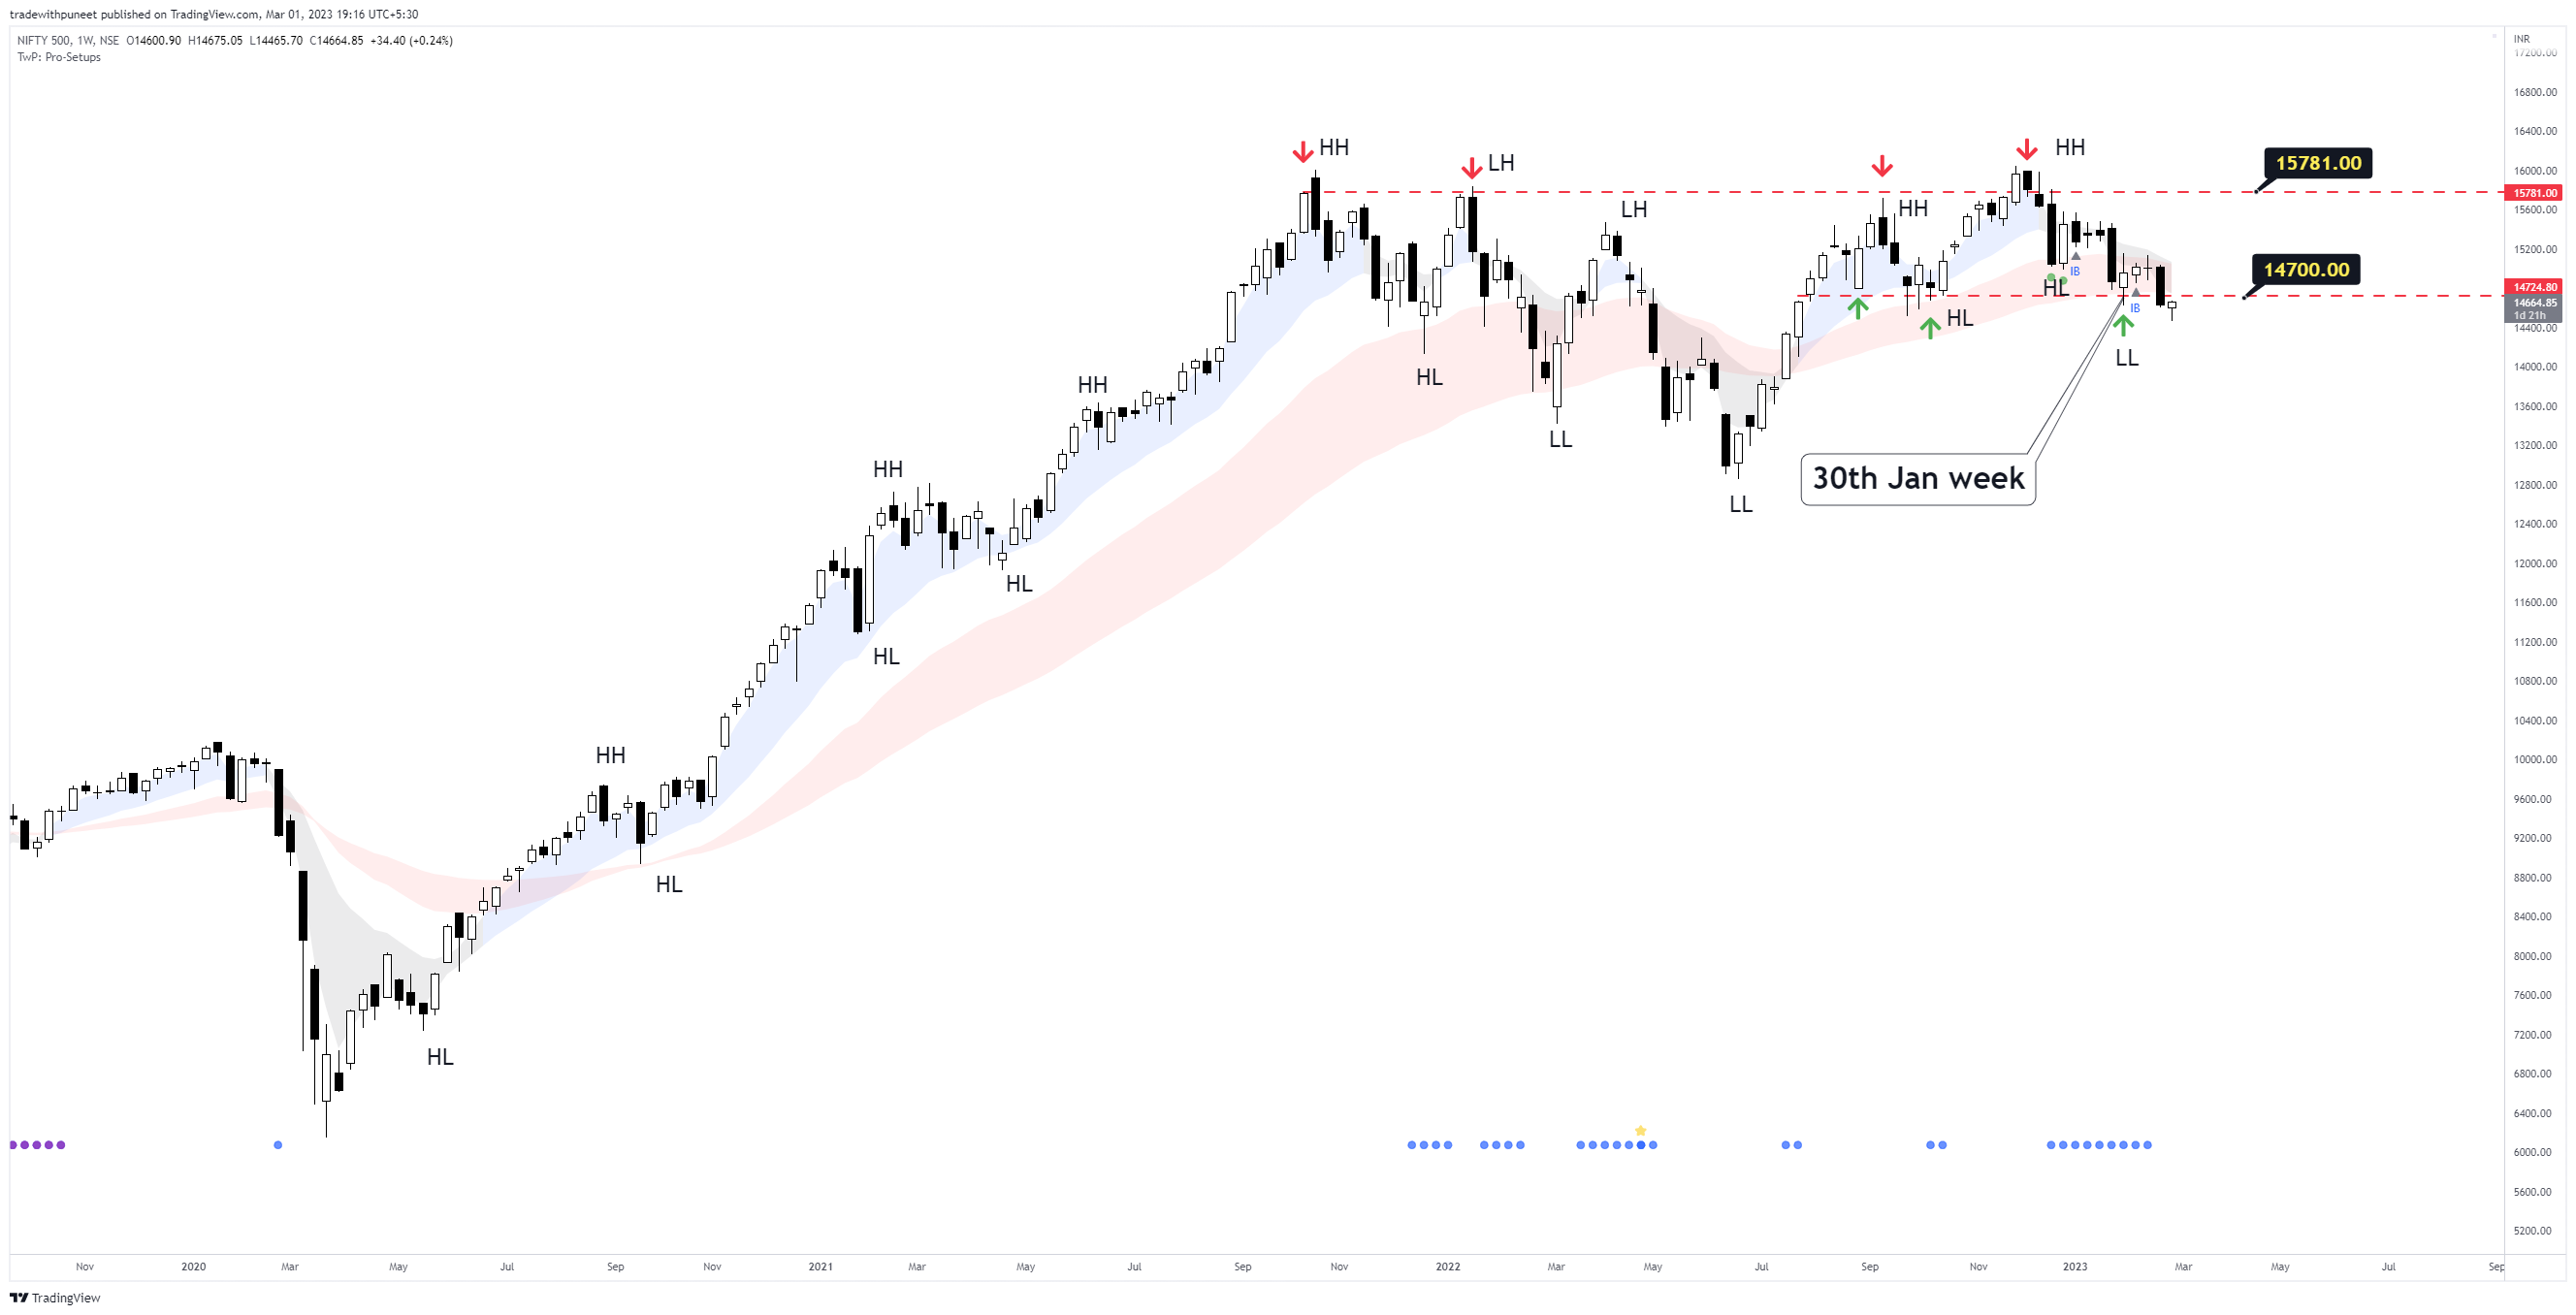
The week starting 30th Jan appeared that we had taken support at around 14700 levels. Clearly that didn’t held up. We were also forming a mini coil, very similar to what we had from 26th Dec - 16th Jan which was followed by a 3% decline in Nifty500 in the subsequent week. The week starting 30th Jan also appeared to be doing the same, and after two weeks, we witnessed a 2.5% fall. We are again at around 14700 levels, and the chart is looking bearish as of today.
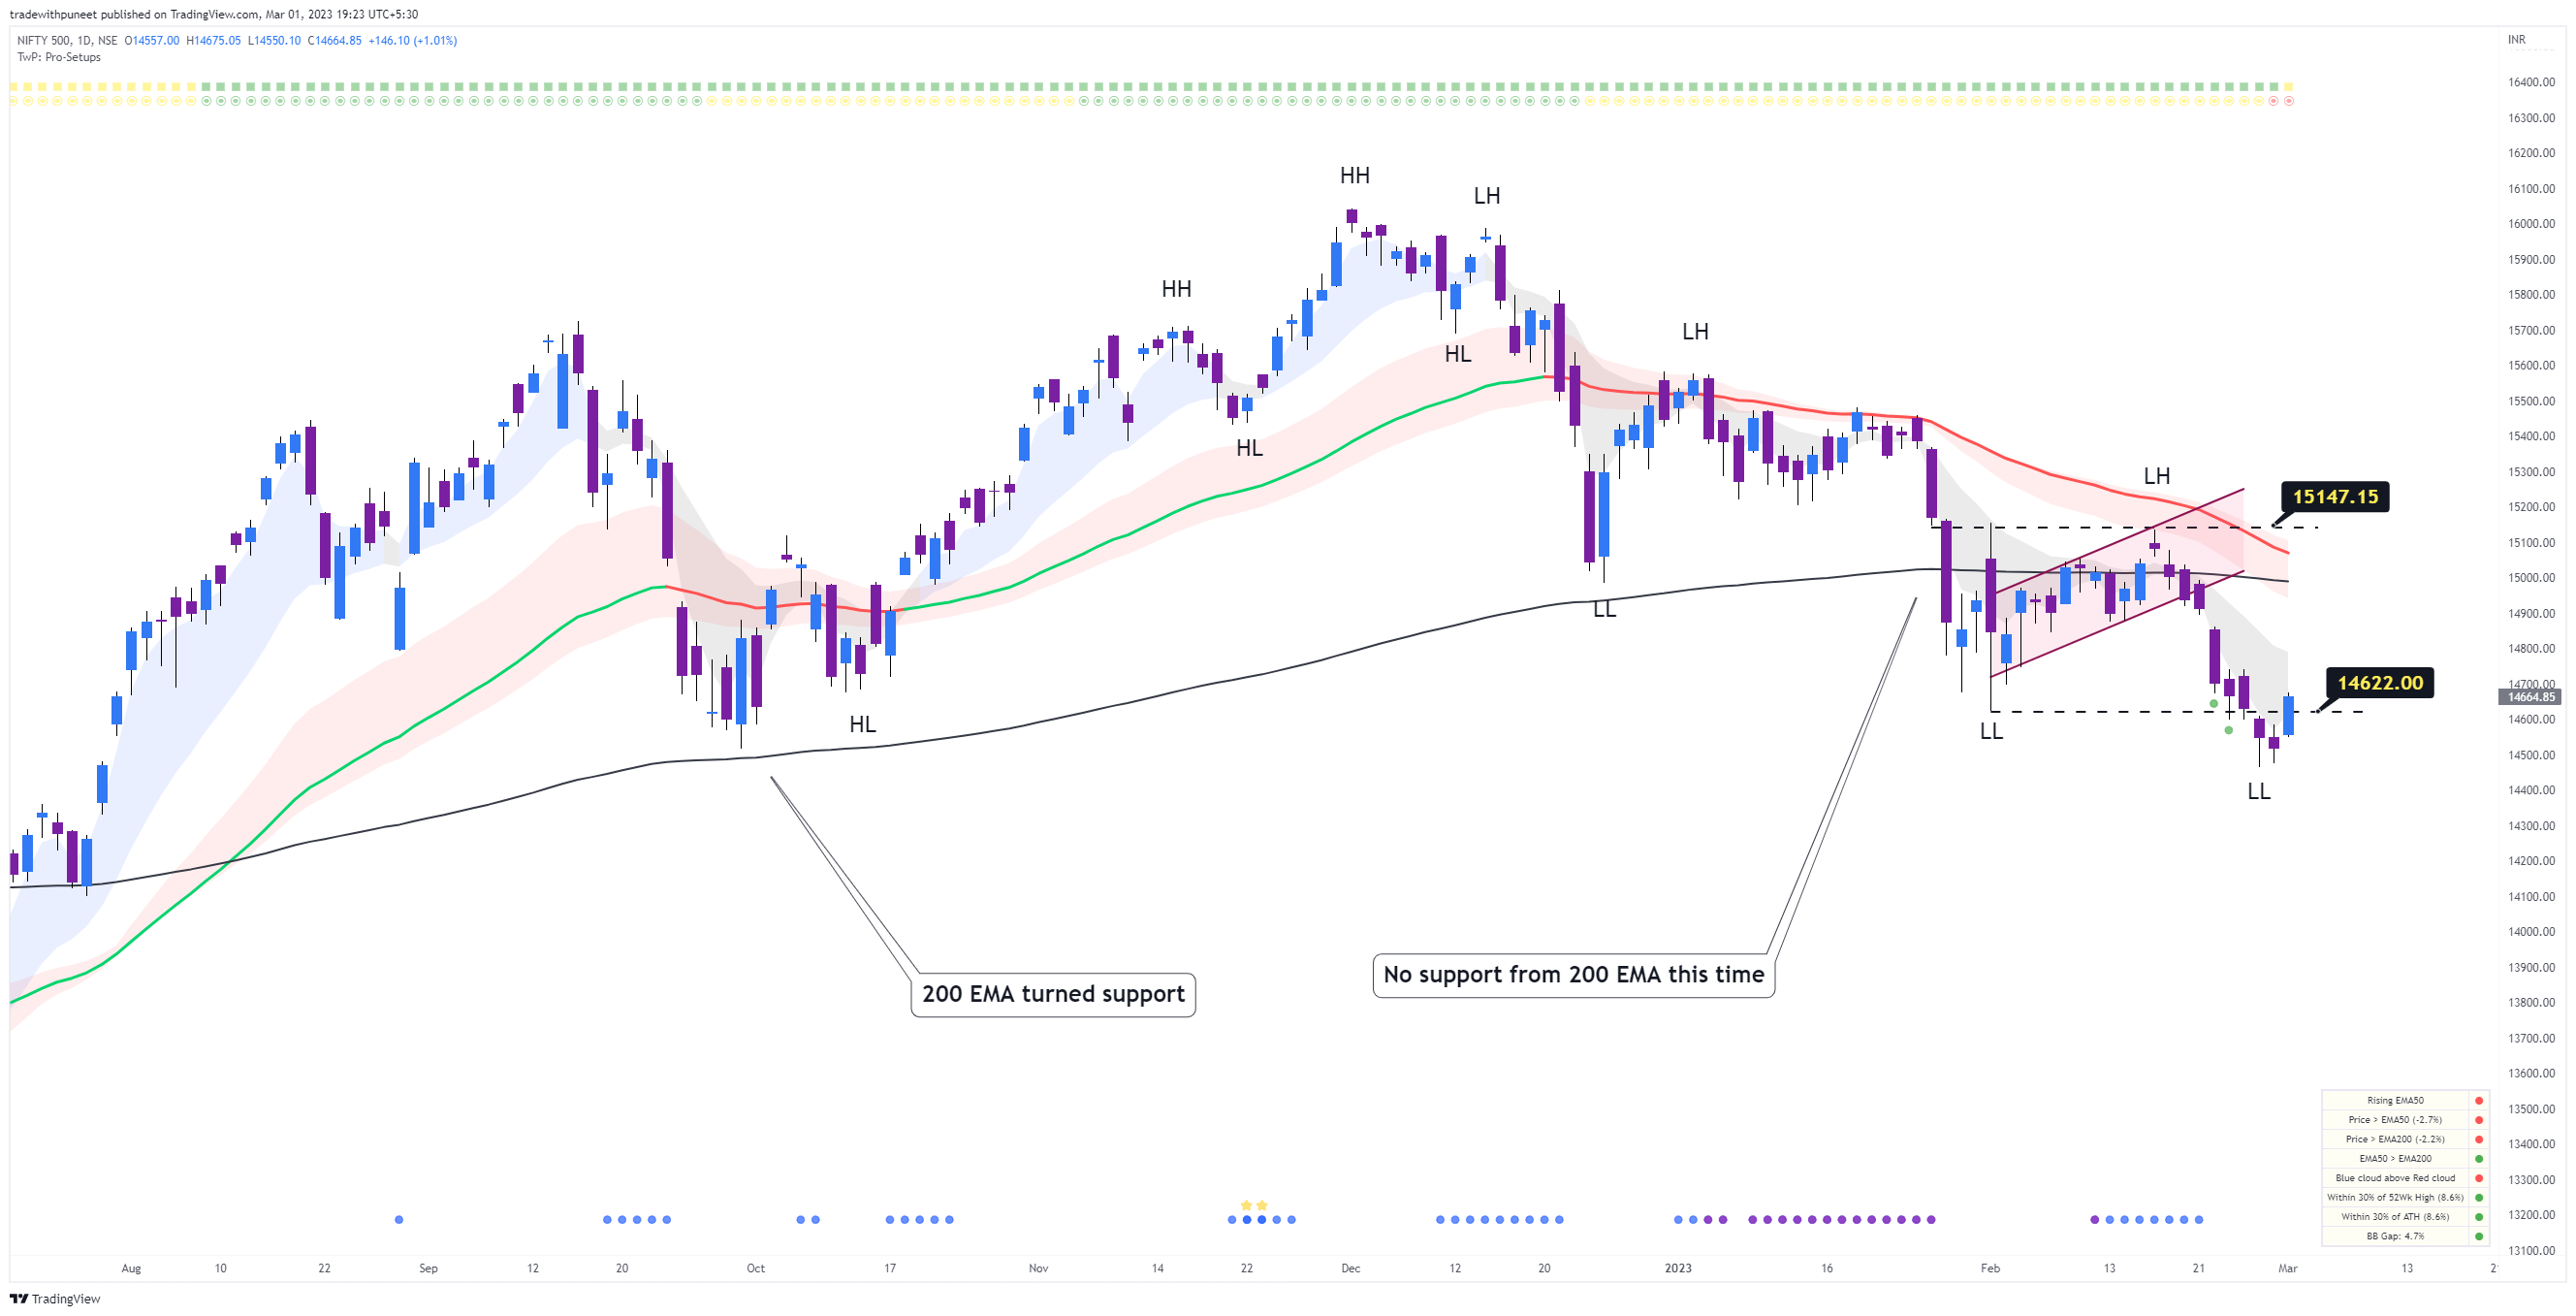
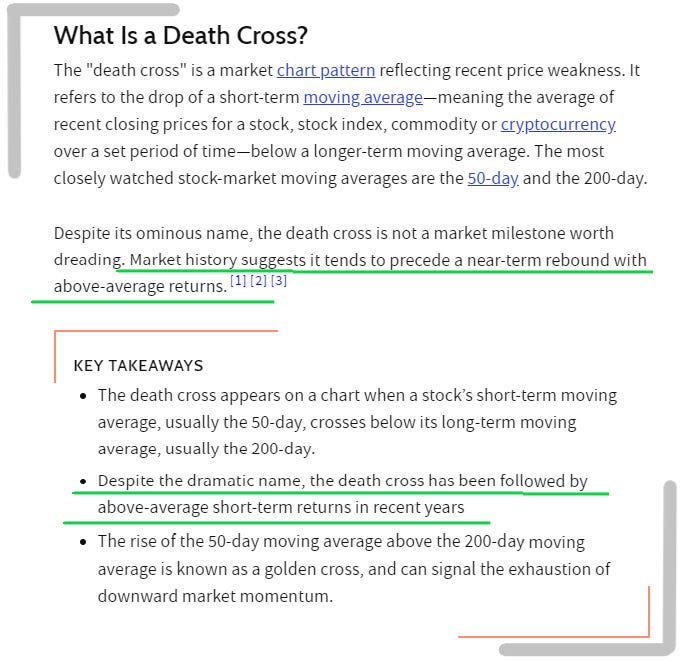
As mentioned before, the support from 200EMA is gone. The bear flag that I mentioned in the 20th Feb update (click here to read it) is also broken. We went near 50EMA (on 16th Feb), but faced resistance there. Soon, we will be meeting declining 50EMA again, where 200EMA will also be there with the welcome drinks. Not just that, we will also be facing the probability of a death cross there. (A death cross is a situation when 50EMA crosses under 200EMA, and it is considered negative in trading community.) But hey! You don’t have to worry because as per Investopedia, a death cross usually precedes a near-term rebound with above-average returns in recent years.
Here is what Investopedia says about a death cross.
50EMA and 200EMA are not magic lines, but they’re important because traders worldwide scan and take action based on them.
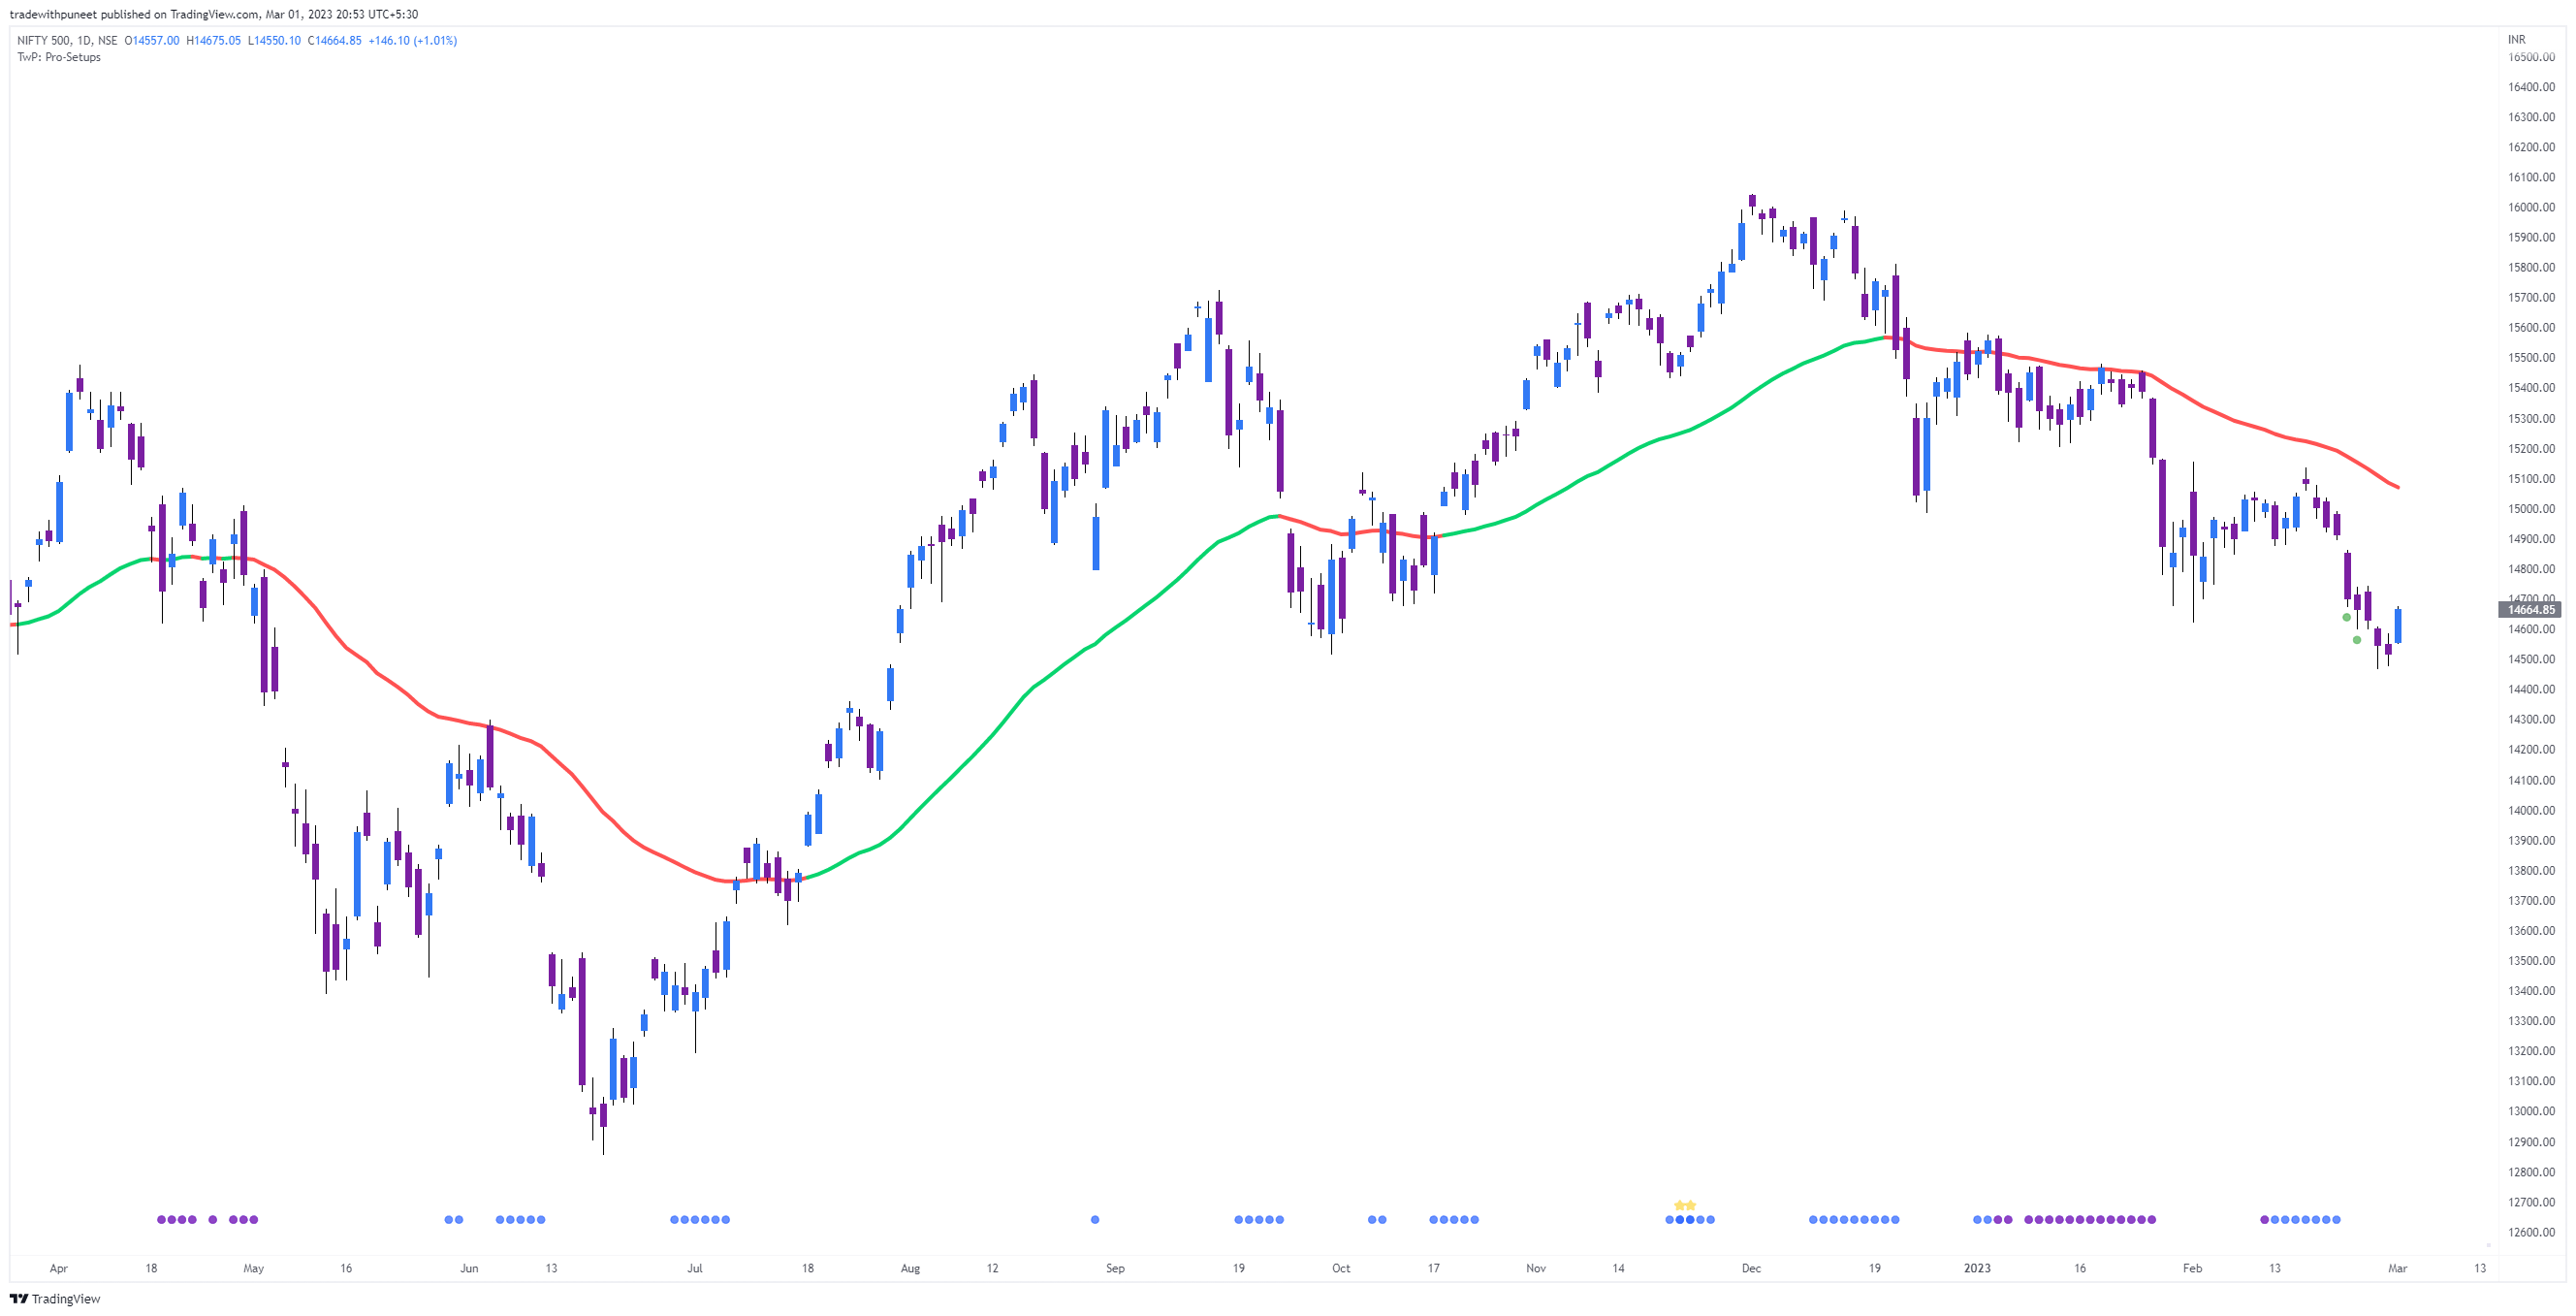
The case of rising and declining 50EMA
One simple hack is to restart trading or increase exposure once 50EMA starts to trend upwards again. Just look at this chart with 50EMA printed on it. The green line represents rising 50EMA and red line represents declining 50EMA. If one had simply stopped/curtailed trading when 50EMA line turned red, he/she could have avoided losses too. It ain’t so difficult. By the way, some of my recent trades have failed too, so this reminder is applicable to me too.
Conclusion
Except the above-mentioned facts, I do not have anything to change since the last update. Negative stance continues. If you’re a swing/positional trader (like me), you will be noticing that some of your positions will be making gains, while others will be taking away those gains. Breakouts have consistently failed. It is difficult to hold gains for a longer duration. Remember that if you are entering longs right now, you are just trading the bounce.
Till the time we do not take control of 50EMA, it is better to not take fresh trades or if you cannot stop that itch, keep tight stops, even tighter trailing stops, and lesser expectations of higher gains. Avoid leverage, avoid revenge trading, do not believe in profit screenshots, in fact avoid twitter. Take what market gives you and try not to give back to the market. Do not be overly bullish. We are still in a sell-on-rise market.
Also don’t forget to prepare a watchlist of those stocks that are showing high Relative Strength (RS). There is no point of using RS filter in rising market. It is now when you should be using it. Please use this filter on the Dashboard.
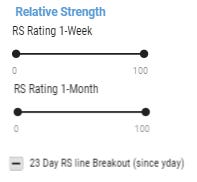
Recently announced quarterly financials + Relative Strength must be checked in order to not enter into those stocks which are already weak.