
Market Sense as on 20th Feb 2023

Market Breadth
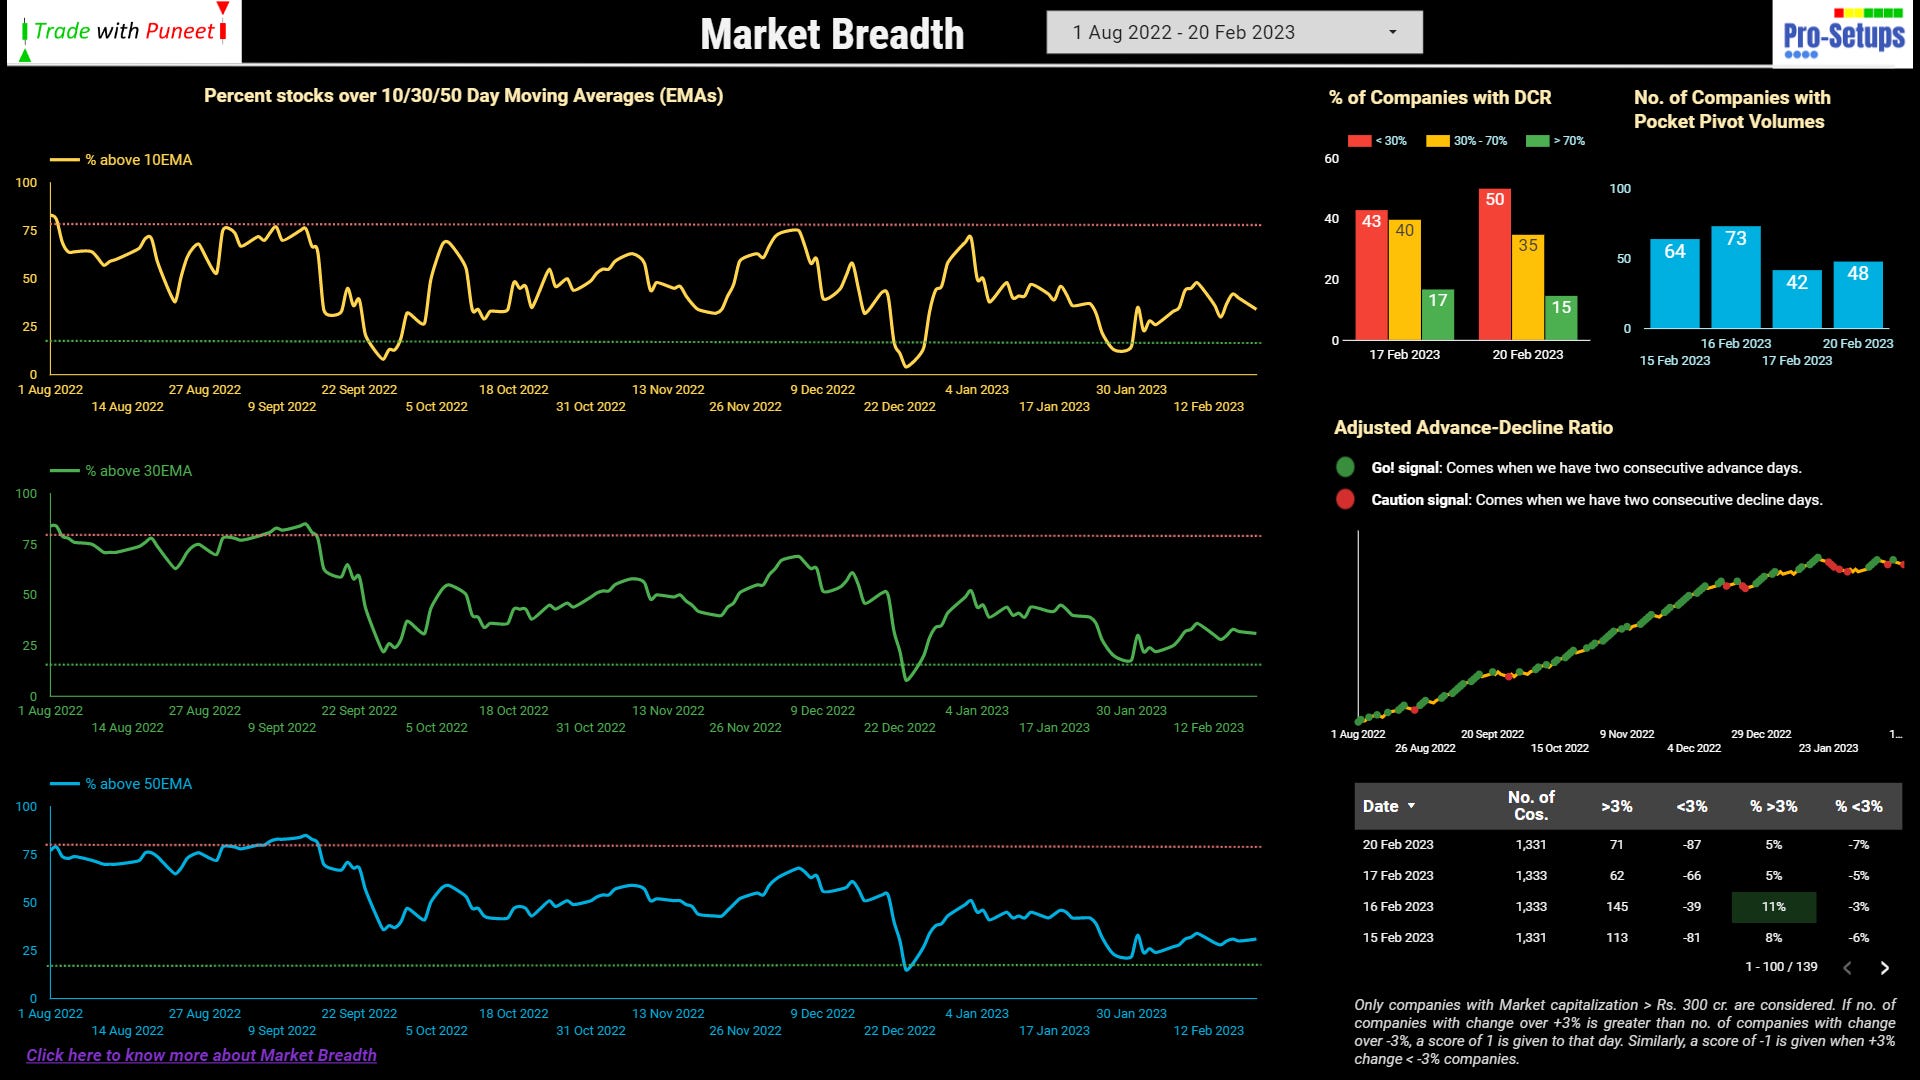
Like I mentioned in the previous update of 15th Feb, Market breadth works best when all three percentage lines are in their extreme zones. At present, we’re neither in an extreme oversold not extreme overbought territory. But given the last touch being the oversold territory, it makes more sense to assume that we need a bit of run up from here.
Nifty500
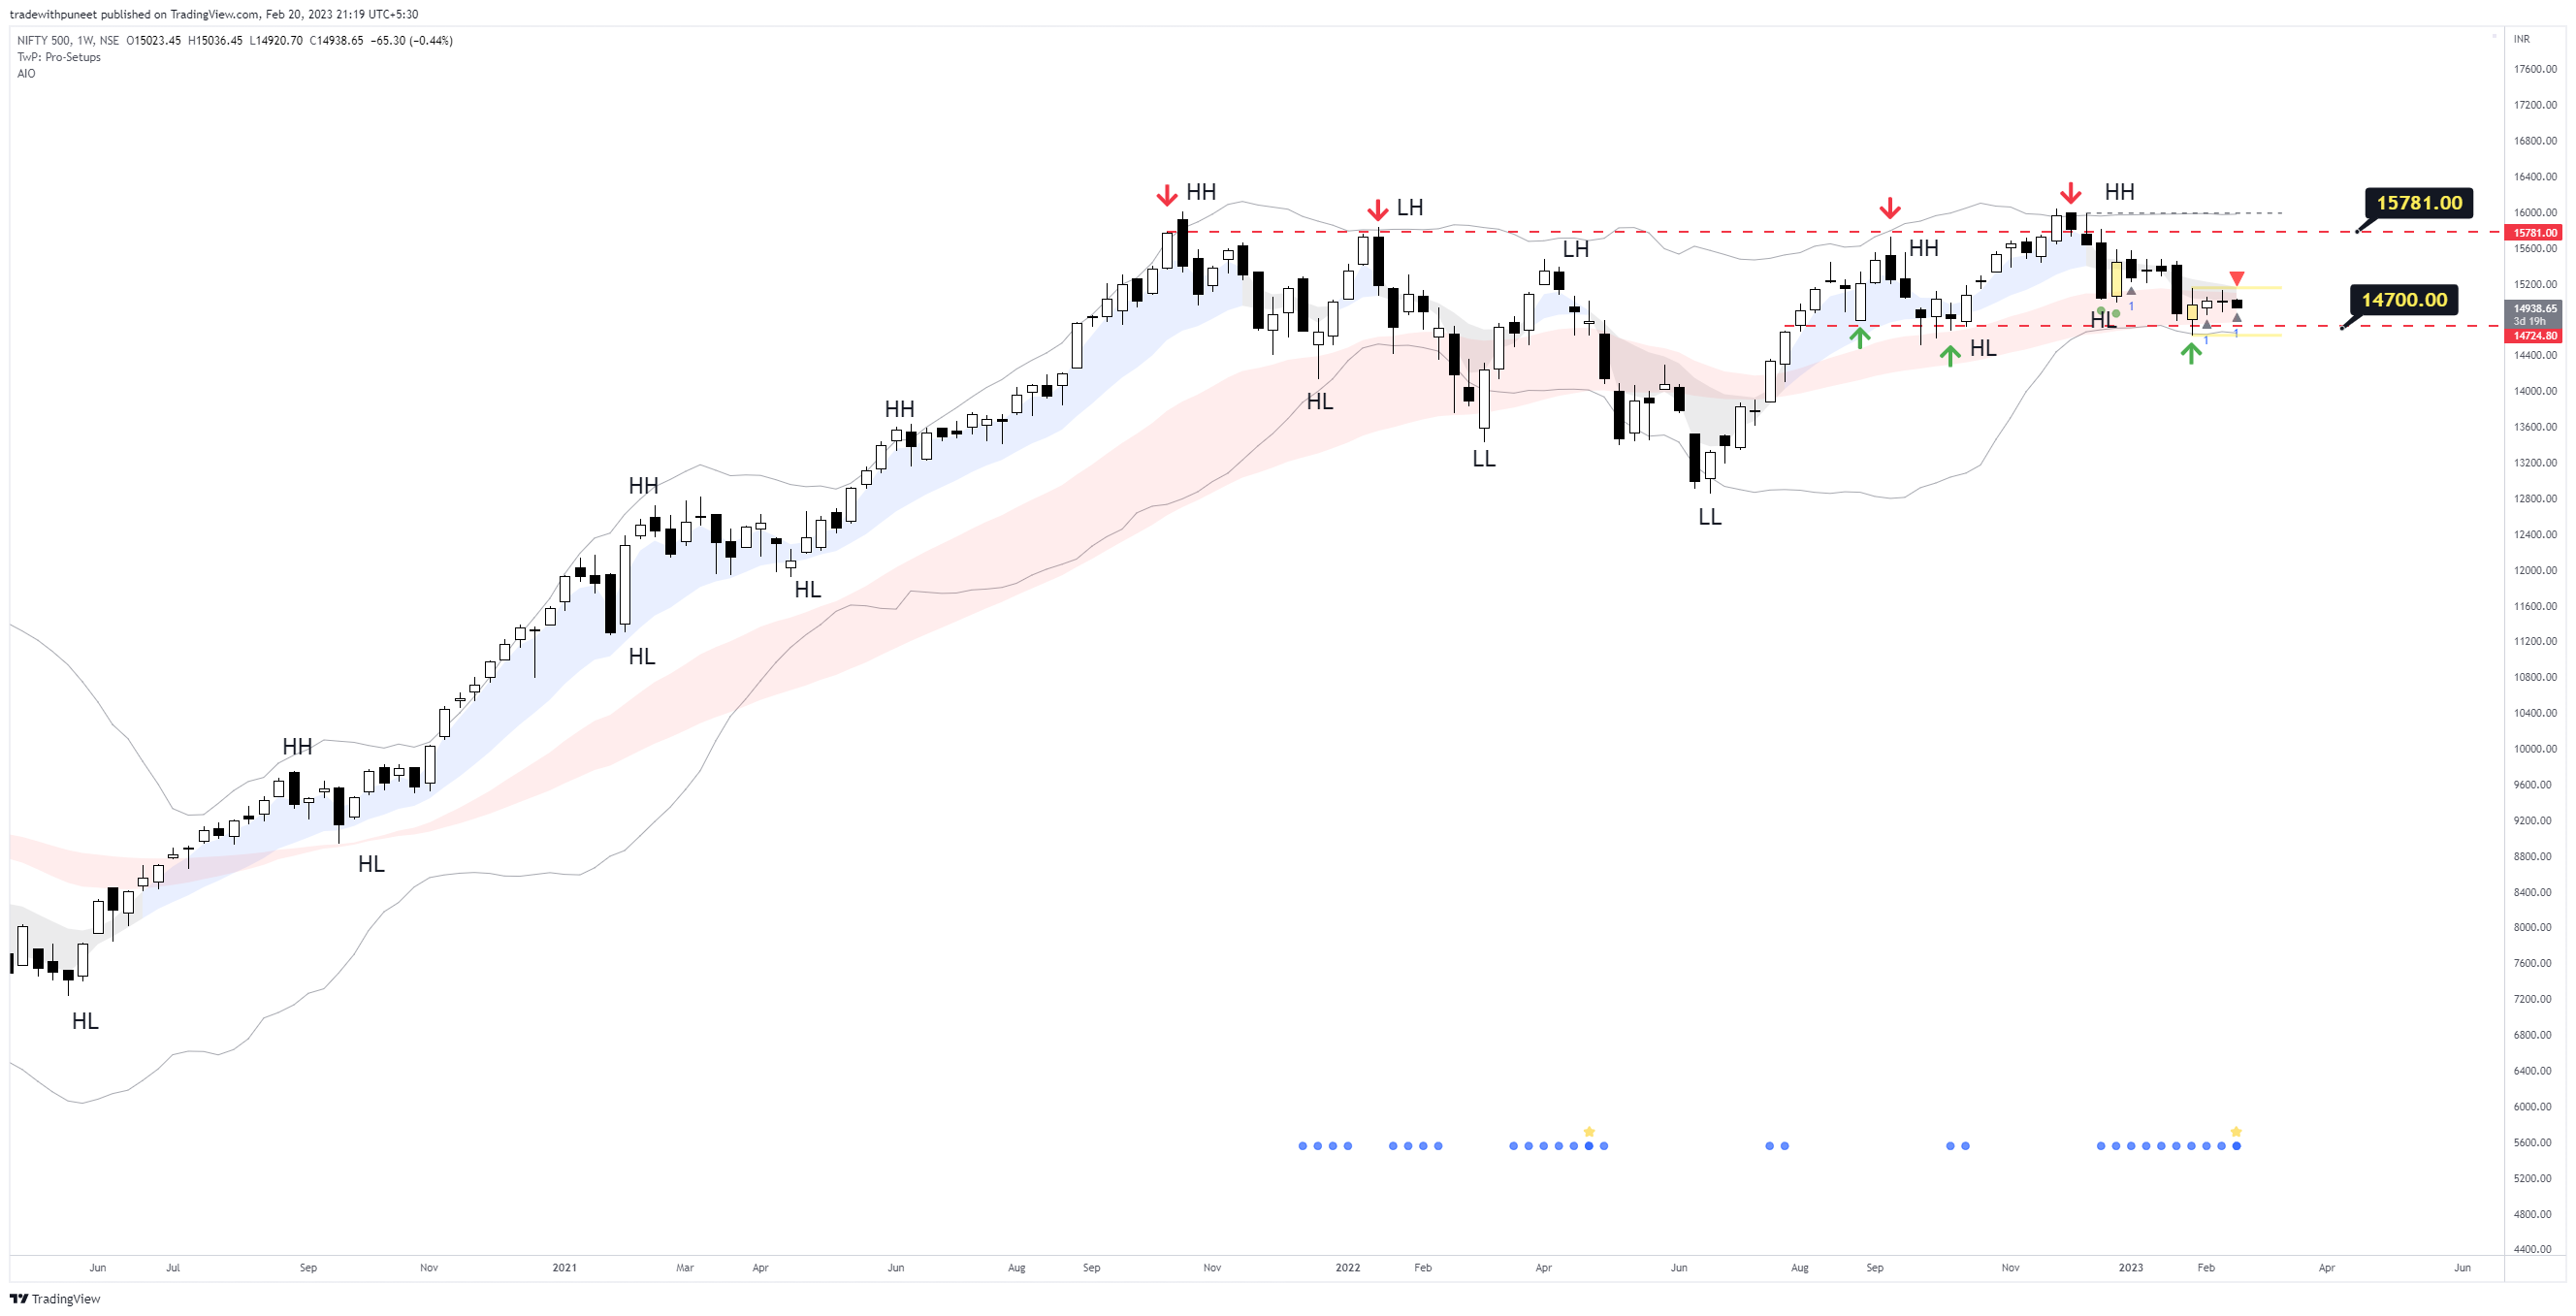
It appears that we have taken support at around 14700 levels. Last week was a doji with 50% WCR, which largely means that we are in an indecision stage. We are also forming a coil, very similar to what we had from 26th Dec - 16th Jan which was followed by a 3% decline in Nifty500 in the subsequent week. We obviously would not like to see same thing with our market again. However, the current week has not started well.
On charts, the weekly Nifty500 chart continues to look like an Inverted H&S pattern after an uptrend. Breakout for a long run upwards is not near.
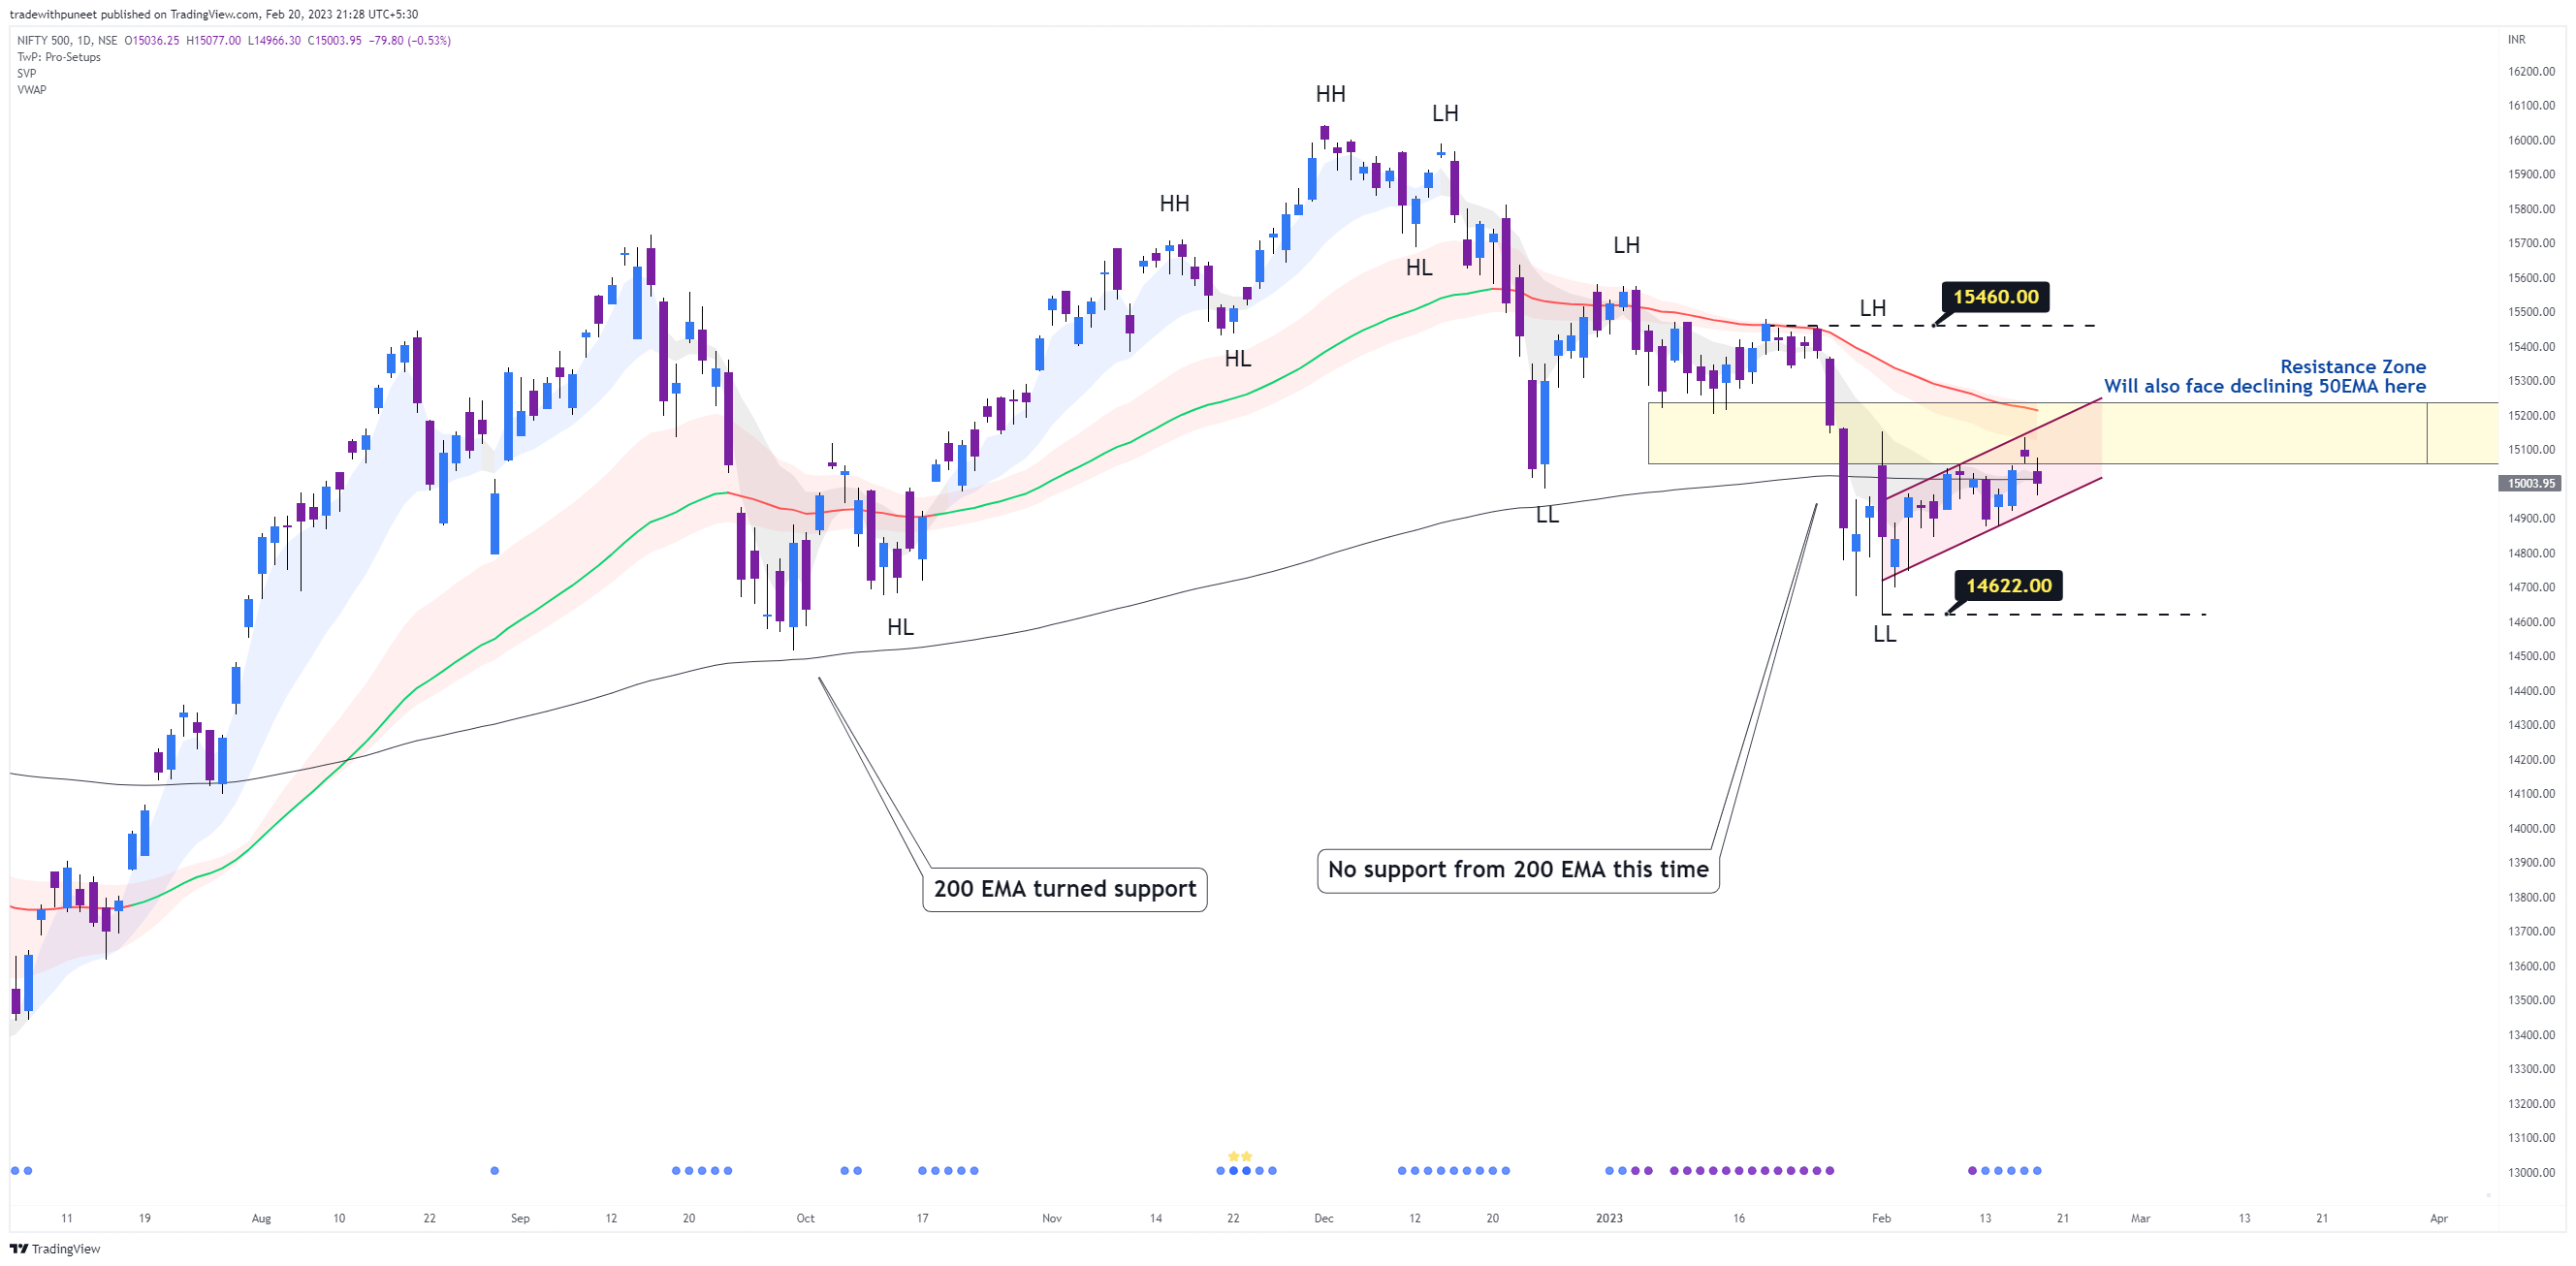
On Daily timeframe chart, we are dancing around 200EMA and facing resistance from declining 50EMA. There is also a bear flag in making.
While Nifty managed to break the Budget day’s high and close above it and also its 50EMA, same is not true for Nifty500.
Conclusion: Negative change since last update. If you’re a swing/positional trader (like me), you will be noticing that some of your positions will be making gains, while others will be taking away those gains. It is difficult to hold gains for a longer duration. Till the time we do not take control of 50EMA, it is better to keep tight stops, even tighter trailing stops, and lesser expectations of higher gains. Take what market gives you and try not to give back to the market. Do not be overly bullish. We are still in a sell-on-rise market and any further fall will be a signal to quickly close open positions.