
Market Sense as on 27th March 2023
Negative stance continues.

I wrote the last market sense update on 14th March (click here to read). The only change that has happened since then is that we made a new bear flag on Nifty500, and then broke it.
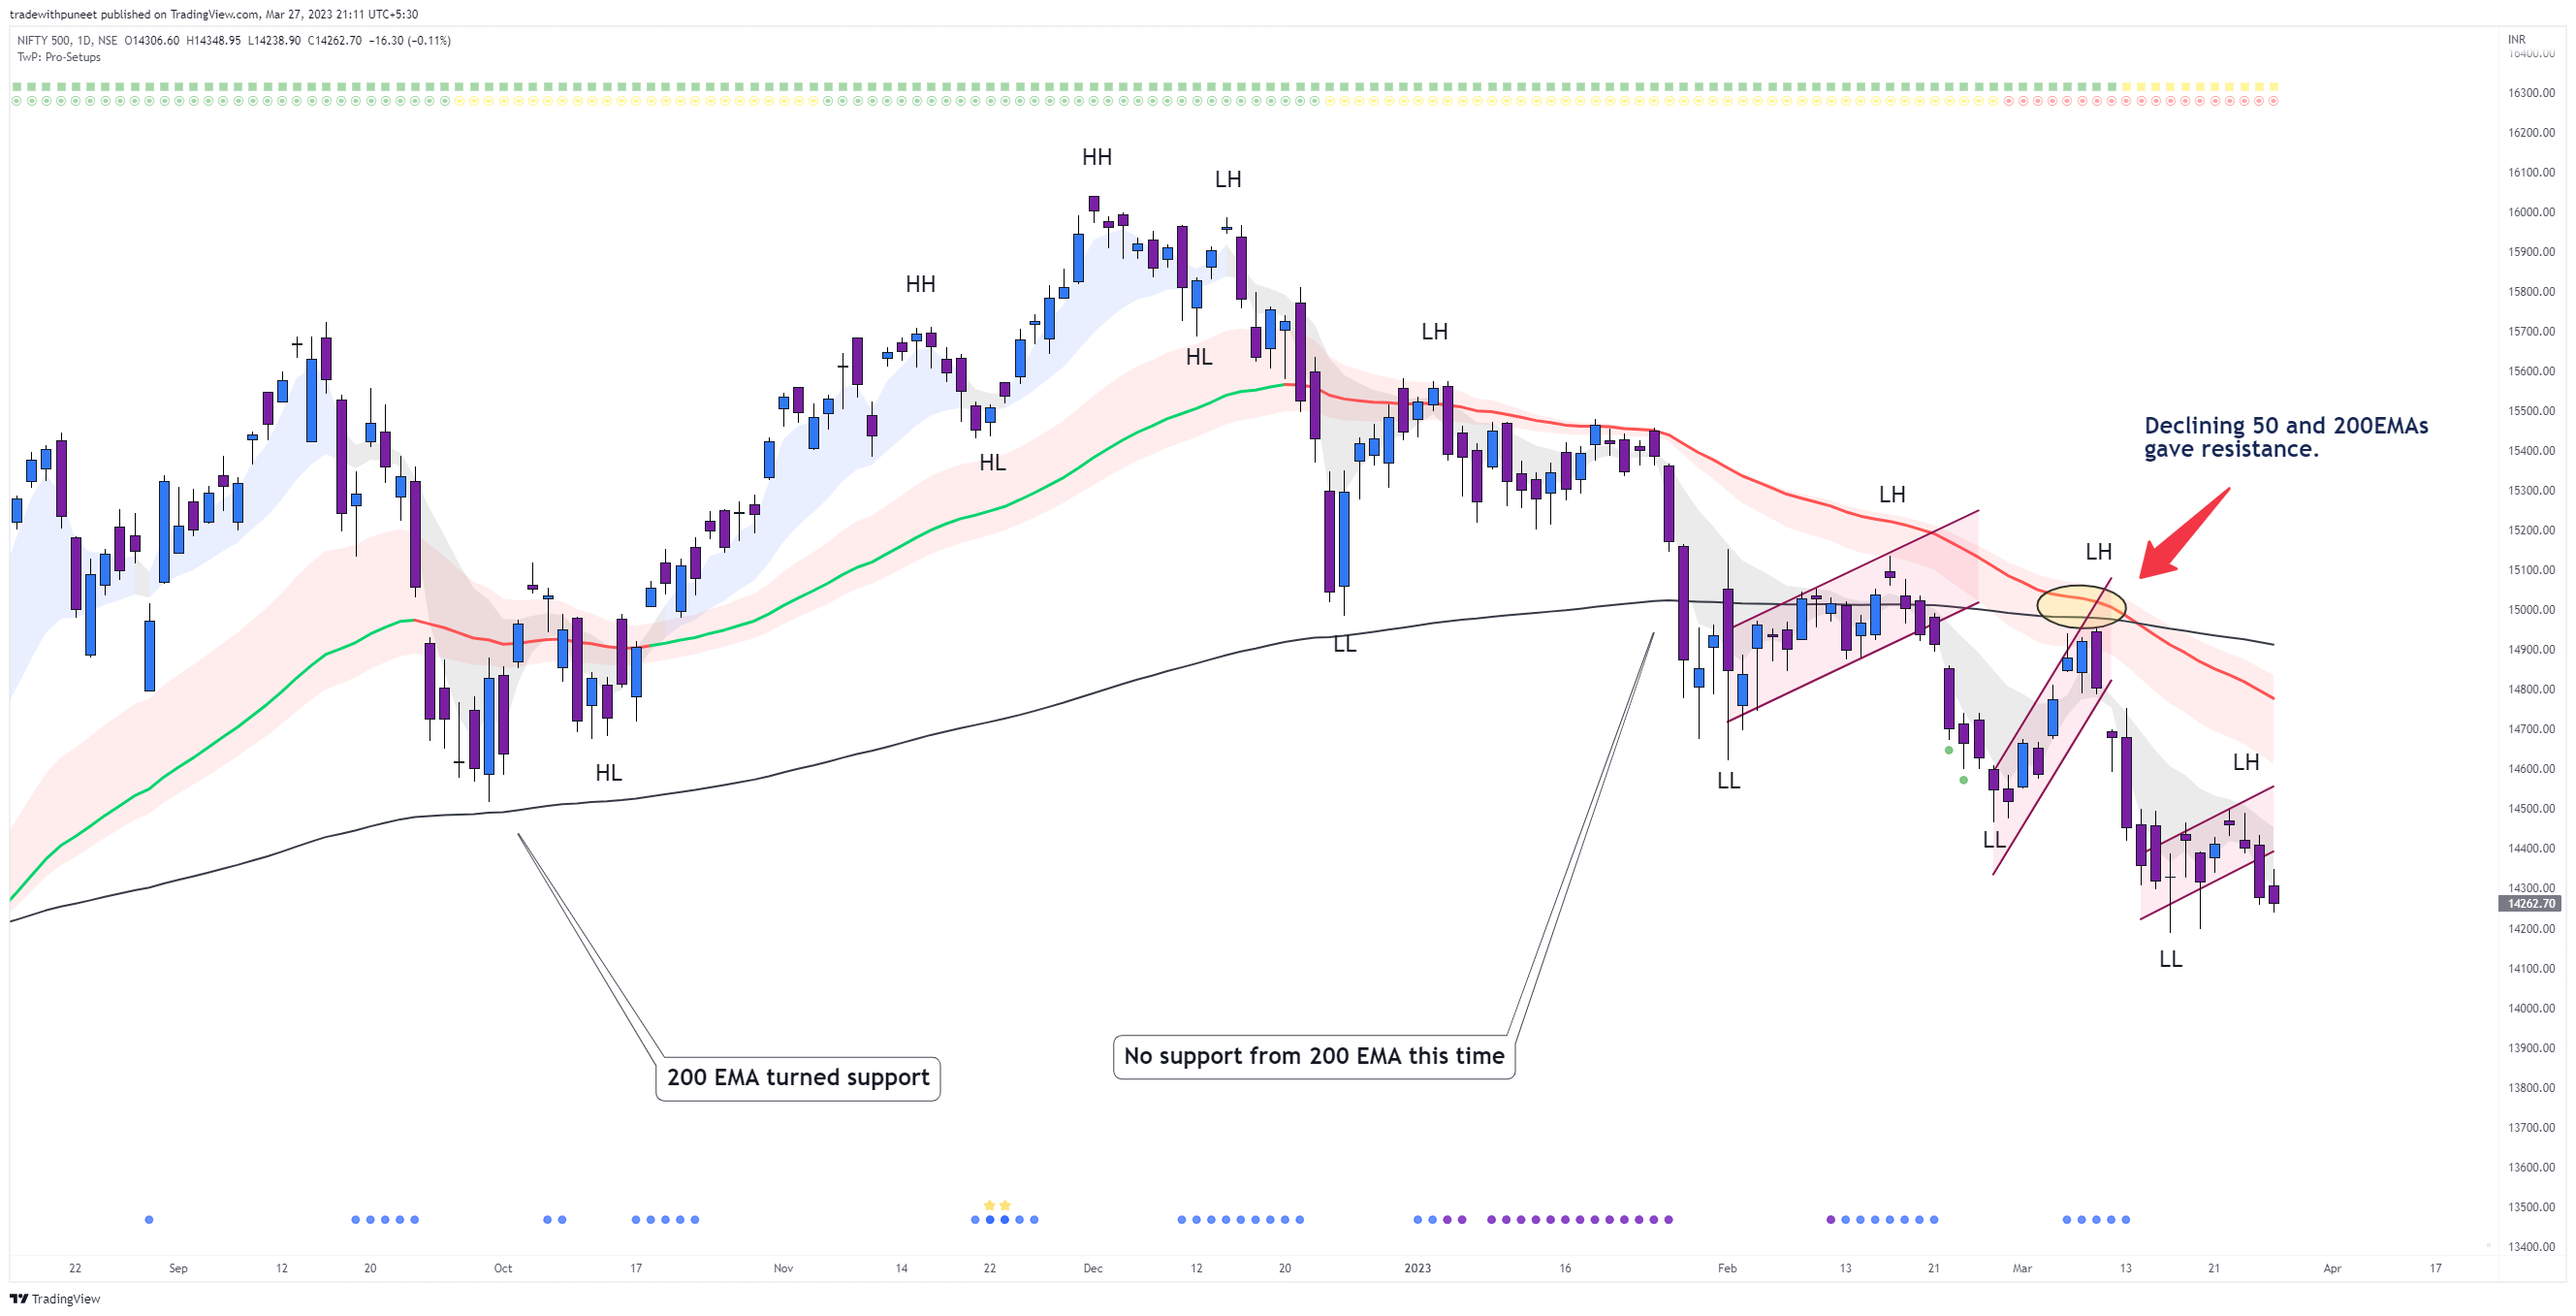
Have a look at the Nifty500 chart below. I consider Nifty500 only because it represents over 80% of the Indian market cap listed on NSE and measures the performance of the broader Indian market, as compared to Nifty50.
Bear flags, death cross, lower lows lower highs, resistance from declining 50 & 200EMAs… all negative pointers remain on the chart.
Market Breadth
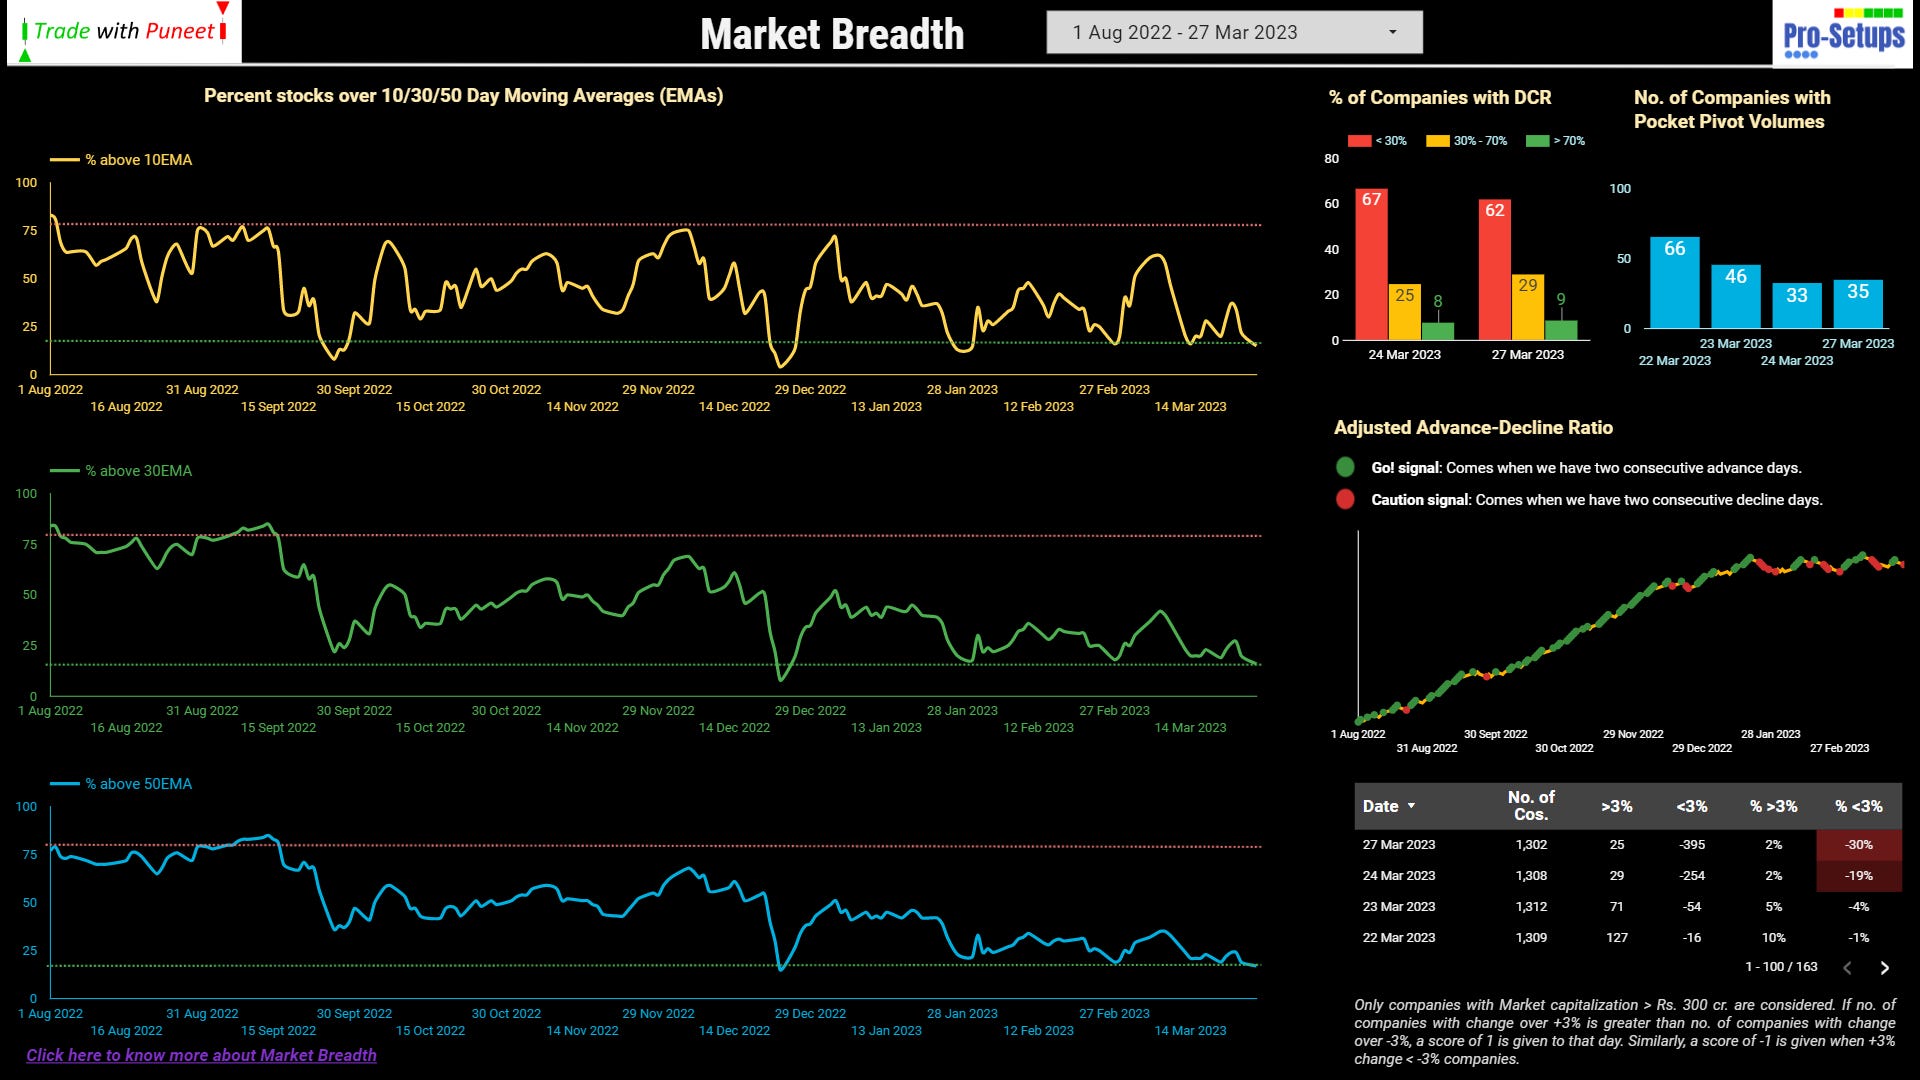
We have reached oversold zone again, though not in the extreme zone yet. We should have a bounce soon.
Our good friend - Srinivas - recently made a good observation that during bull market, the key MA lines on market breadth chart can remain near the overbought zone for a long time; while during bear market, the same MA lines are expected to stay near the oversold zone for a longer time, with tiny bit of bounces here and there. These bounces usually make the bear flags. I totally agree with Srinivas on this.
What next? (again a repeat from the previous update)
I do not have anything to change since the last update. Negative stance continues. Breakouts have consistently failed. It is difficult to hold gains for a longer duration. Remember that if you plan to enter longs right now, you will just be trading the bounce.
Till the time we do not take control of 50EMA, it is better to not take fresh trades or if you cannot stop that itch, keep tight stops, even tighter trailing stops, and lesser expectations of higher gains. Avoid leverage, avoid revenge trading, do not believe in profit screenshots, in fact avoid twitter. Take what market gives you and try not to give back to the market. Do not be overly bullish. We are still in a sell-on-rise market.
One simple hack is to restart trading or increase exposure once 50EMA starts to trend upwards again and turns green on your Pro-Setups script. Read more about the case of rising & declining 50EMA here.