
Newsletter for the week ending Aug 2, 2024
In this newsletter, we discuss what are TTM squeeze setups and how to scan them, along with some charts for your Watchlist. Plus, a brief commentary on Market Sense and Sectoral Performance.

Market Sense
Did anything change this week? Well, not much technically.
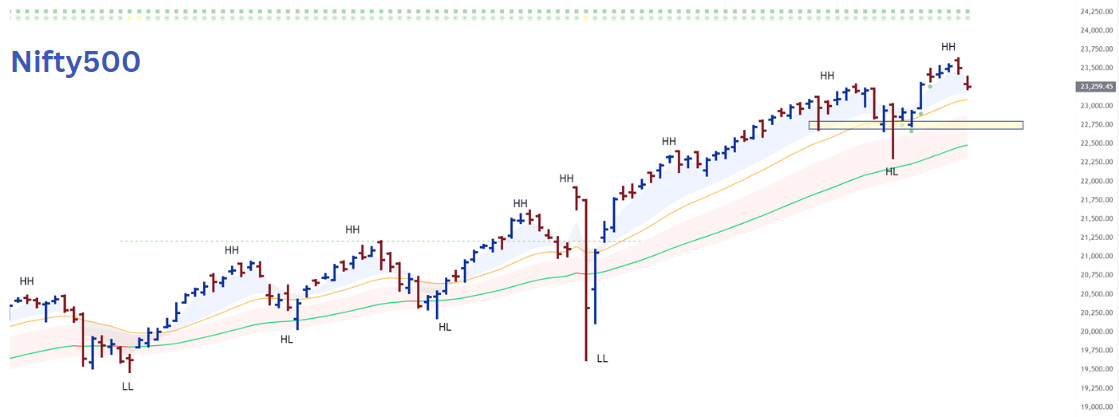
Nifty500 continued its strong momentum, hitting All-Time-High in 4 out of the 5 trading sessions, before global sell-off made it giving up all gains for the week on Friday. For the week, it closed flat. The reason why we talk of Nifty500 instead of Nifty50 is because the former represents over 90% of the listed market capitalization, while the later represents just 50%.
There seems to be a growing concern amongst value investors that finding true value in the market is becoming increasingly challenging due to high valuations. Consider this - Nifty500 has increased by 38% in last one year, compared to Nifty500's EPS growing by just 22% over the same period (source: Trendlyne). Earnings need to catch up with the prices. It is important to focus on stocks that are not only reporting strong current numbers but also offer good forward-looking visibility of sustainable growth.
Following the shakeout from the election results, every weakness has been bought by the markets, fueled by robust liquidity. Given this trend, it can be anticipated that any further weaknesses in the coming week is likely to be met with strong buying activity.
Although still strong, market breadth weakened this week, with %age of stocks above 10EMA falling below 50%. %age of stocks above 20EMA and 50EMA have also started to come down this week from their overbought/bullish zones.
Weekly Sector Performance Review
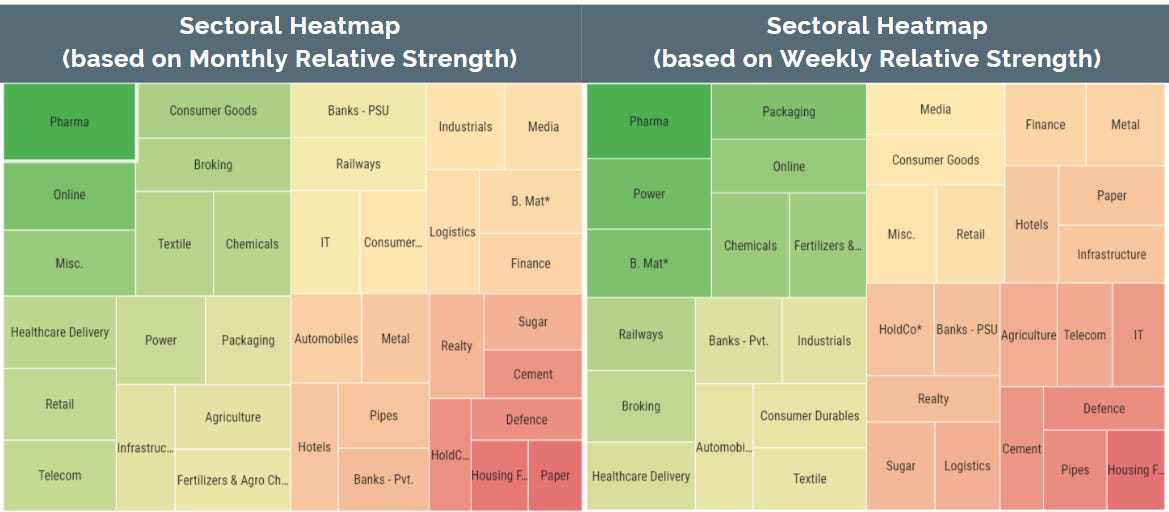
Sectors that are dark green on both heatmaps (top-left corner) are the strongest sectors that have performed on both timeframes. Pharma continues to lead the pack this week as well. Any pullbacks here in strong names can be considered as buying opportunity.
When we try to identify which sector can give us maximum move as a whole, we have to anticipate the movement from light green/yellow to darker green zone. In other words, we try to determine the sector that is not the strongest currently, but can become so in coming weeks. We do it by noticing the movement from lighter green/yellow pasture to darker green pasture. Consider strong setups in Packaging, Power, Healthcare Delivery, Chemicals & Online sectors coming week. For Consumer Goods sector, one has to further drill down to industries level for a better study.
Sectors at the bottom-right (deep red) on both timeframes can be avoided, until they start showing signs of strength.
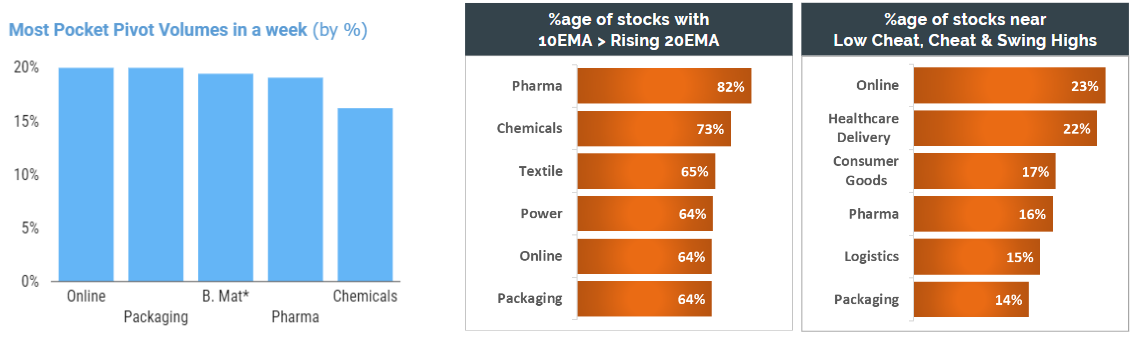
Going by volume, Online & Packaging sectors top the charts with highest average pocket pivot volumes in the week. Over 20% of stocks in Online and Healthcare Delivery sectors are near their Low Cheat, Cheat & Swing Highs levels.
TTM Squeeze
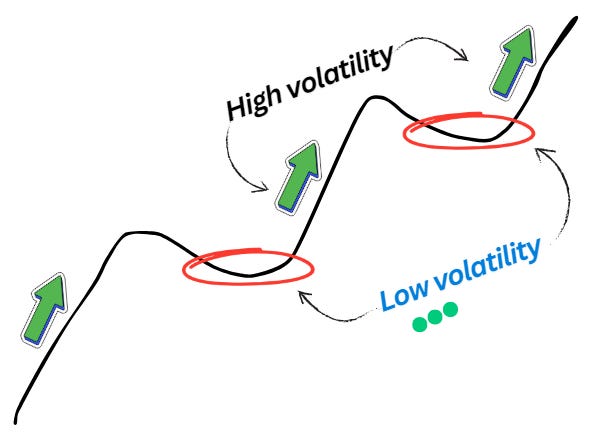
Stocks do not move in one direction. A stock experiences fluctuations, going up and down along its journey.
Low volatility is followed by high volatility and vice versa.
Low volatility period is when price moves within a narrow range and exhibit minimal fluctuation, whereas during high volatility period, price experiences significant fluctuations and large price swings.

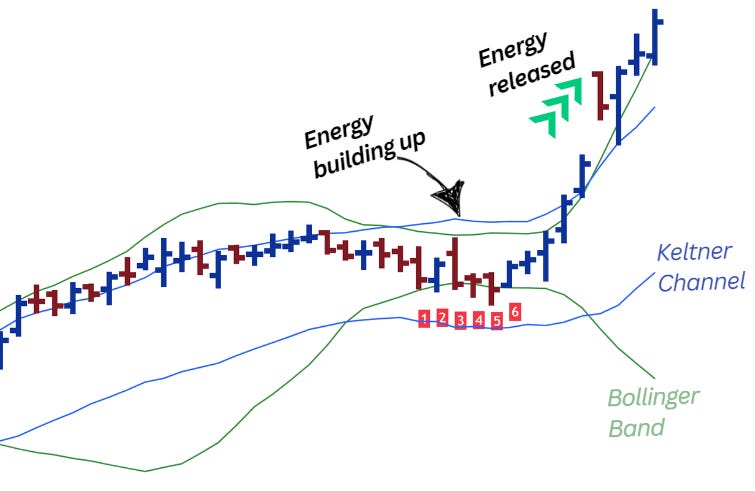
When Bollinger Band is inside the Keltner Channel, the stock is said to be in a ‘Squeeze.’
In the chart on the left, when the green channel (Bollinger band) is inside the blue channel (Keltner channel), it is said to be TTM squeeze.
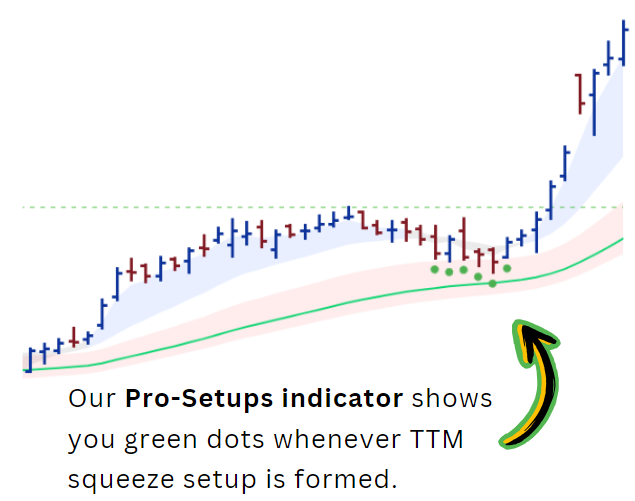
We identify TTM squeeze when Bollinger band is also getting squeezed. Notice bars marked 1 to 6.

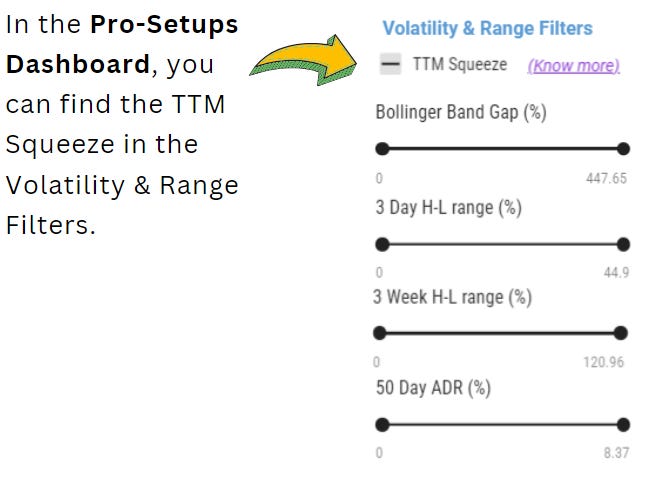
How to scan for TTM Squeeze setups in the Dashboard
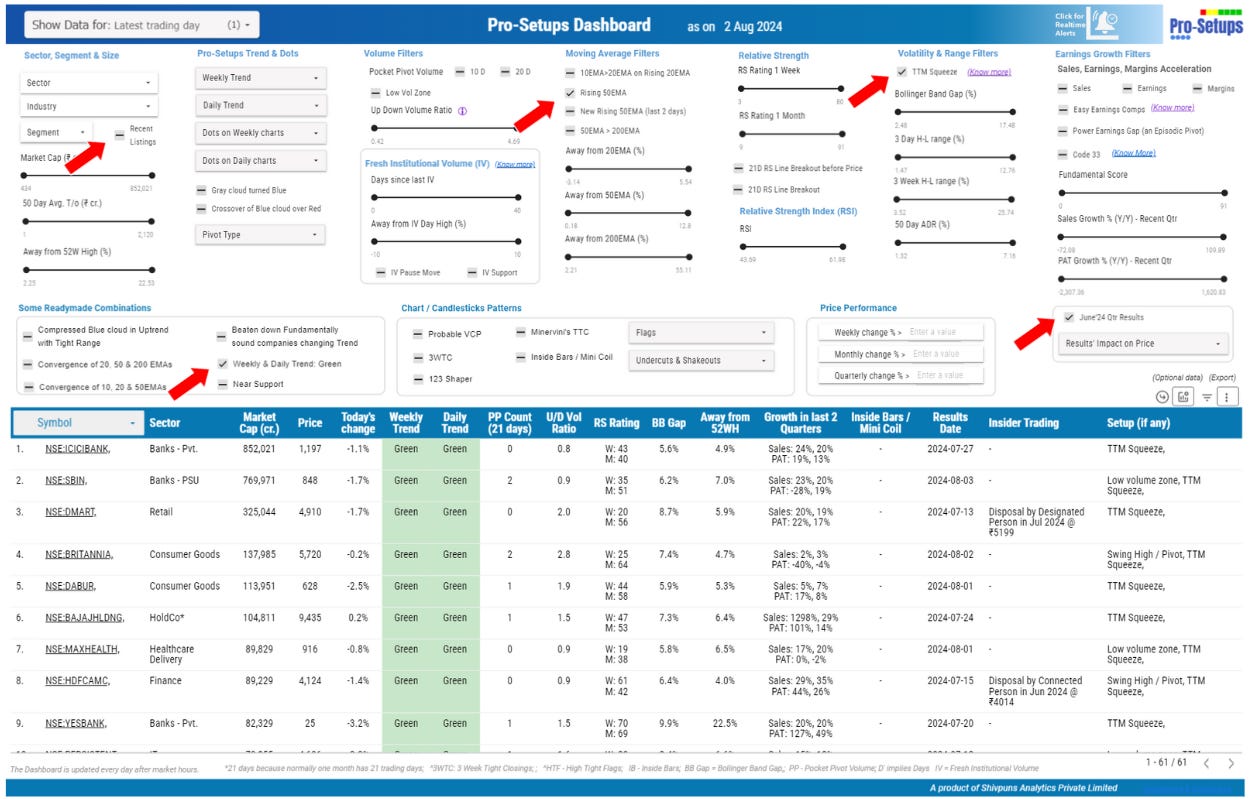
TTM Squeeze filter should not be used in isolation. Remember that the very purpose of this filter is to identify setups that are experiencing low volatility periods. To this, we have to add the probability of a stock to go up. Thus, we choose following filters:
TTM Squeeze
Green trend (Uptrend) on Weekly & Daily Timeframes
Rising 50EMA
Secondly, since we’re in midst of Earnings season, it is better to remove any uncertainty by considering only those names that have reported June quarter results.
June’24 quarter results announced
On selection of Green trend on Weekly & Daily timeframes, all Recently Listed stocks were removed from the Screener results because of their limited trading history. Hence, we reset the Screener page, and choose following filters:
Recent Listings
TTM Squeeze
If you’re a swing trader, you can further reduce the Bollinger Band Gap to a maximum of 12-13%.
TTM Squeeze setups for your watchlist
For full list, please download the Newsletter.
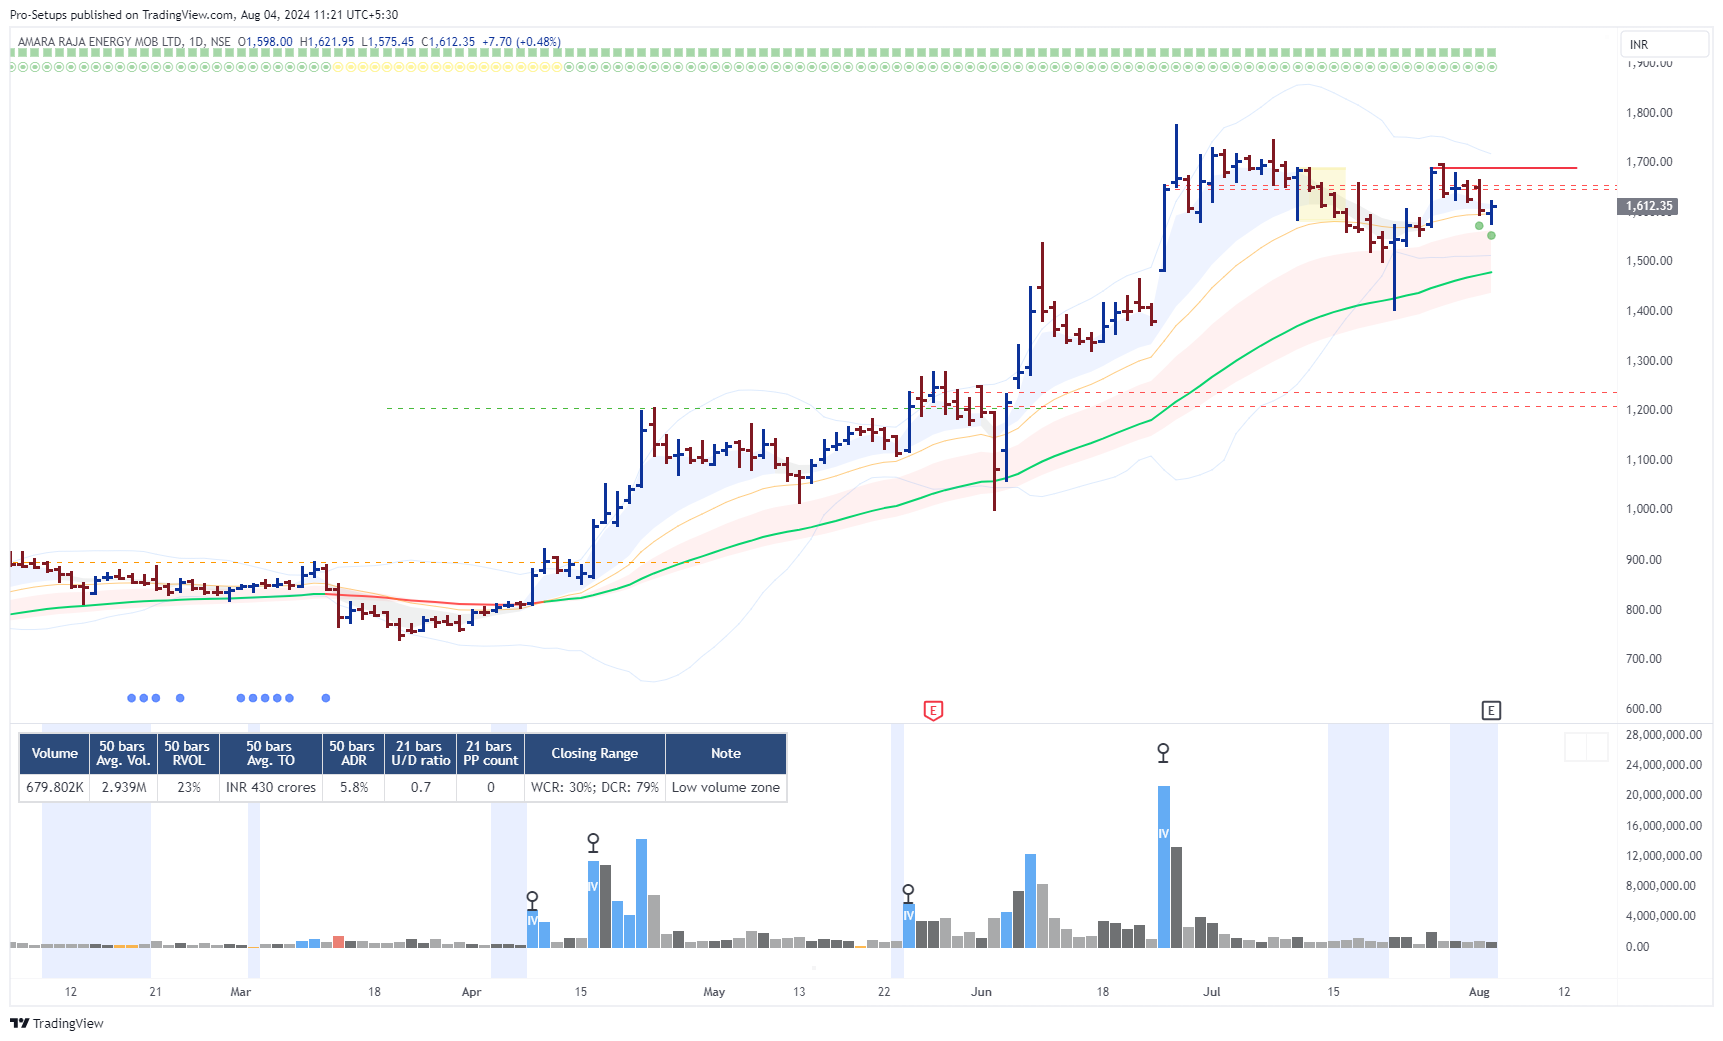
Amara Raja Energy & Mobility
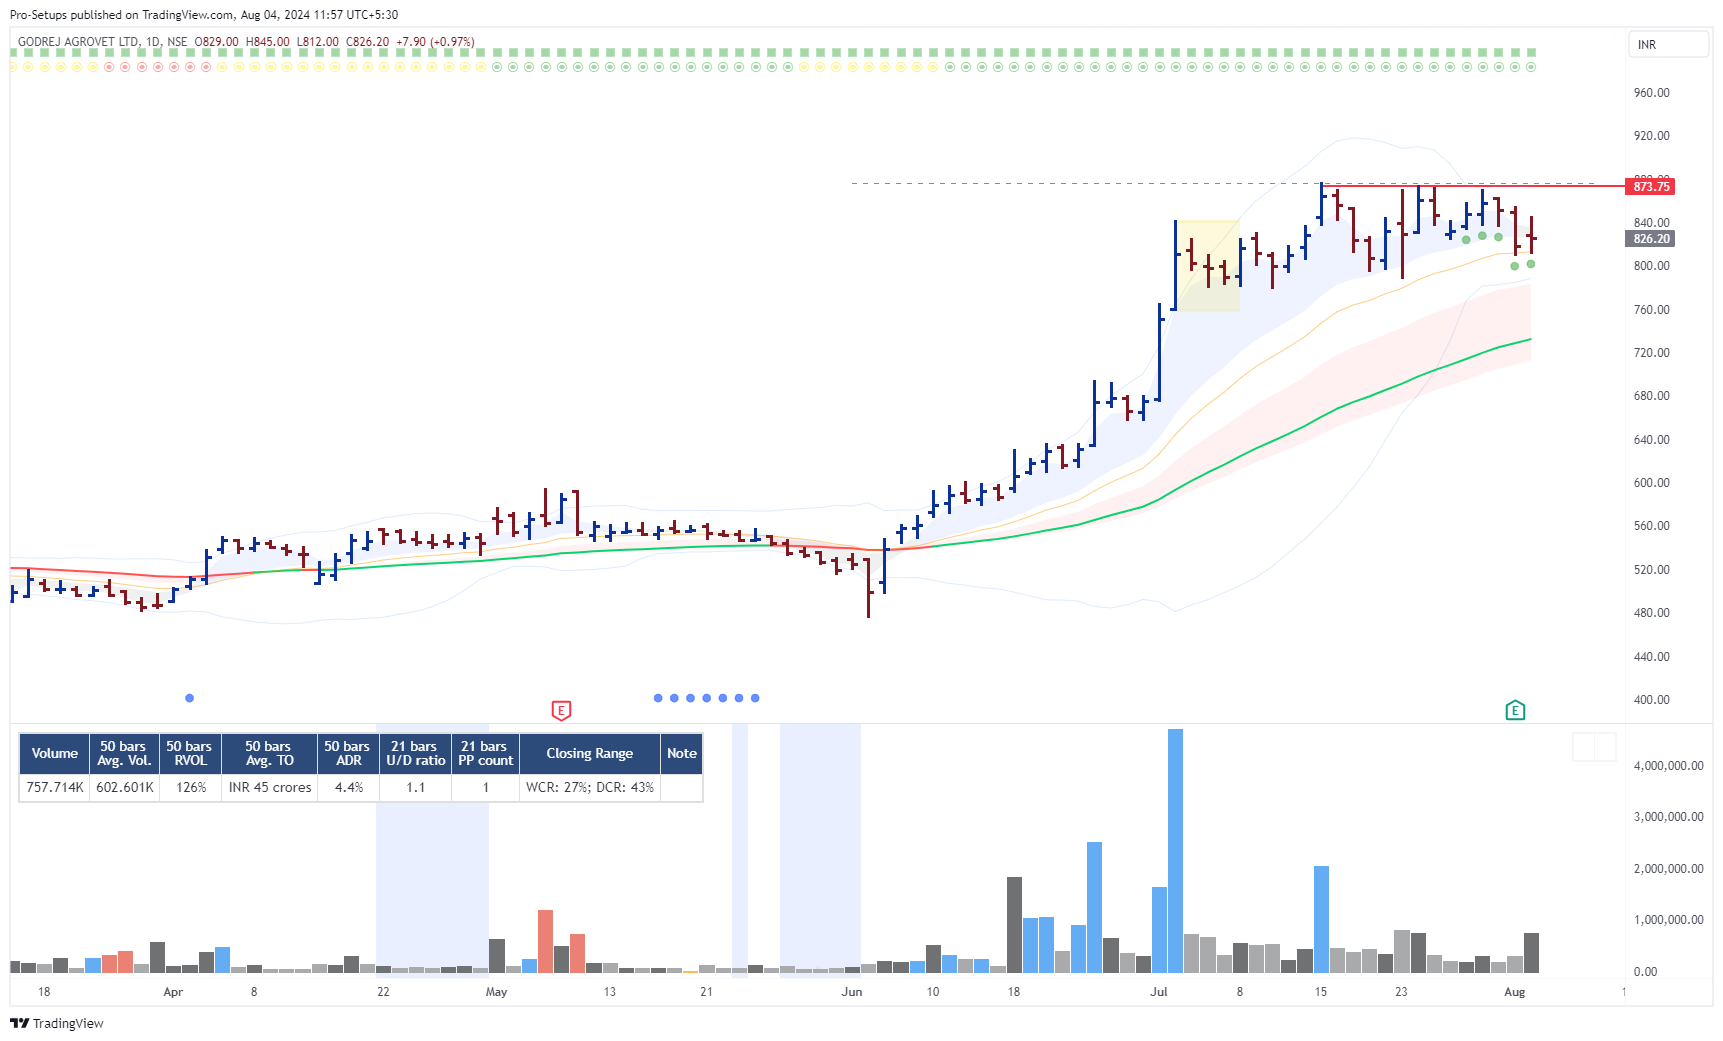
Godrej Agrovet
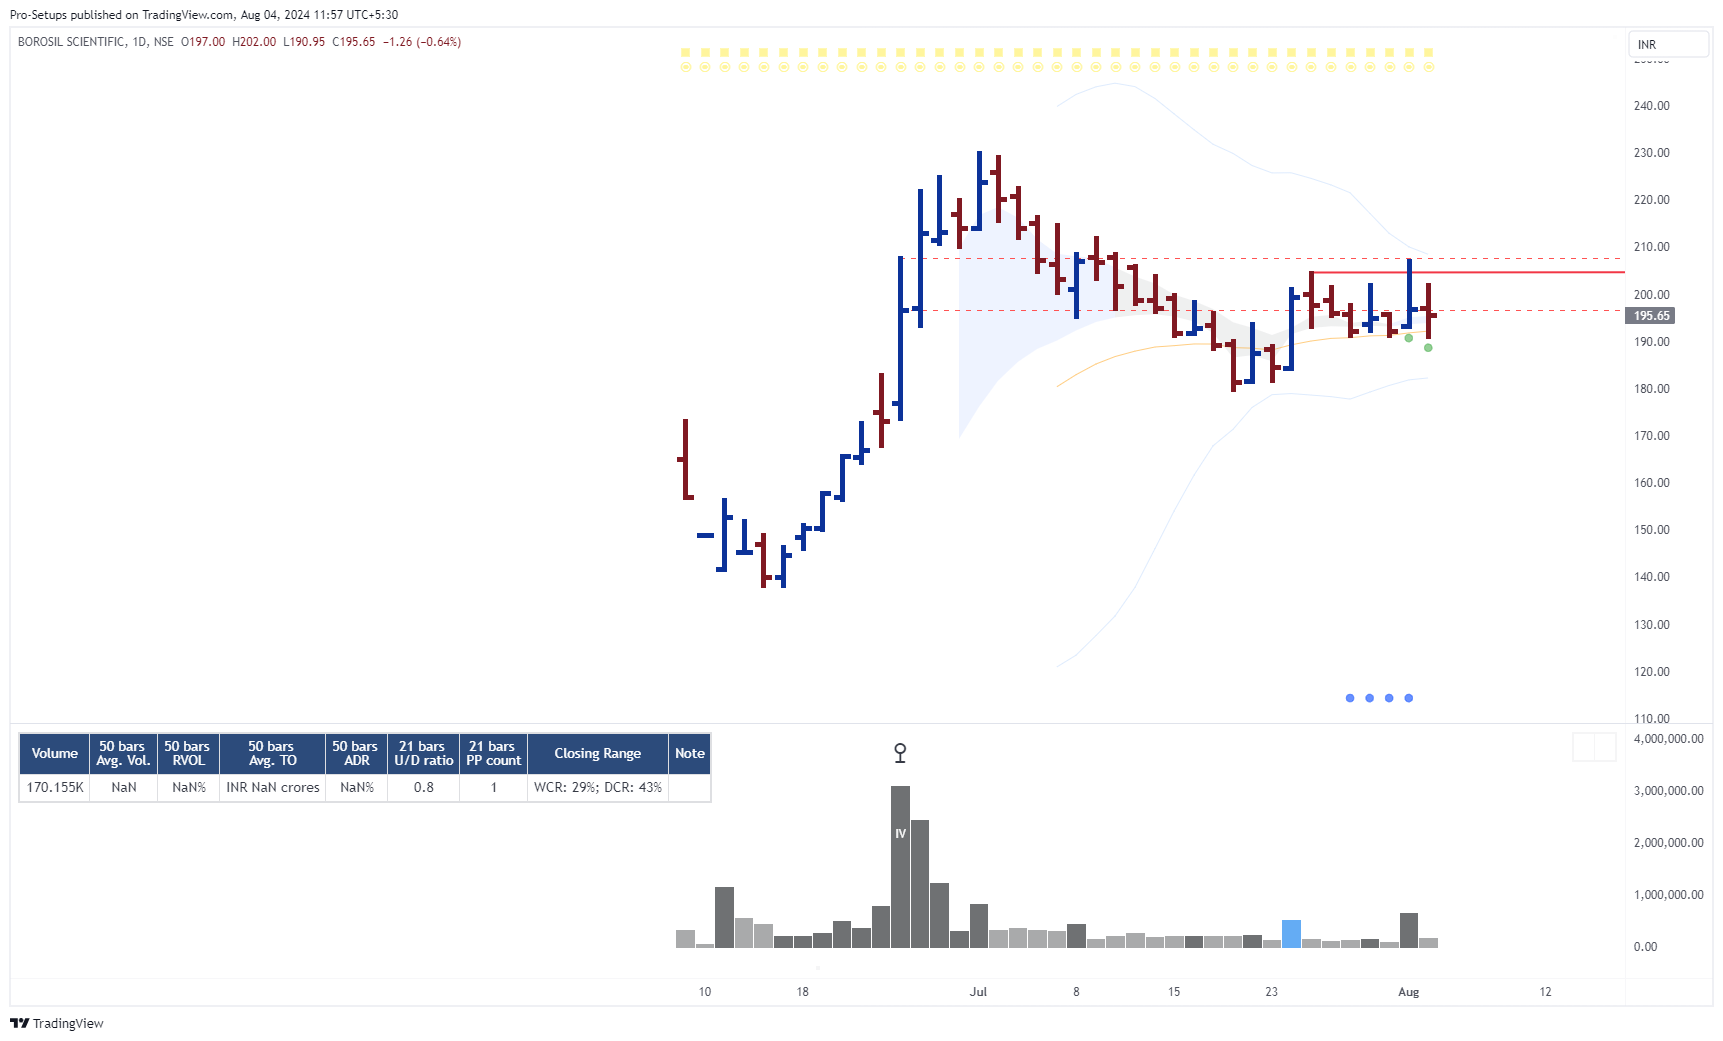
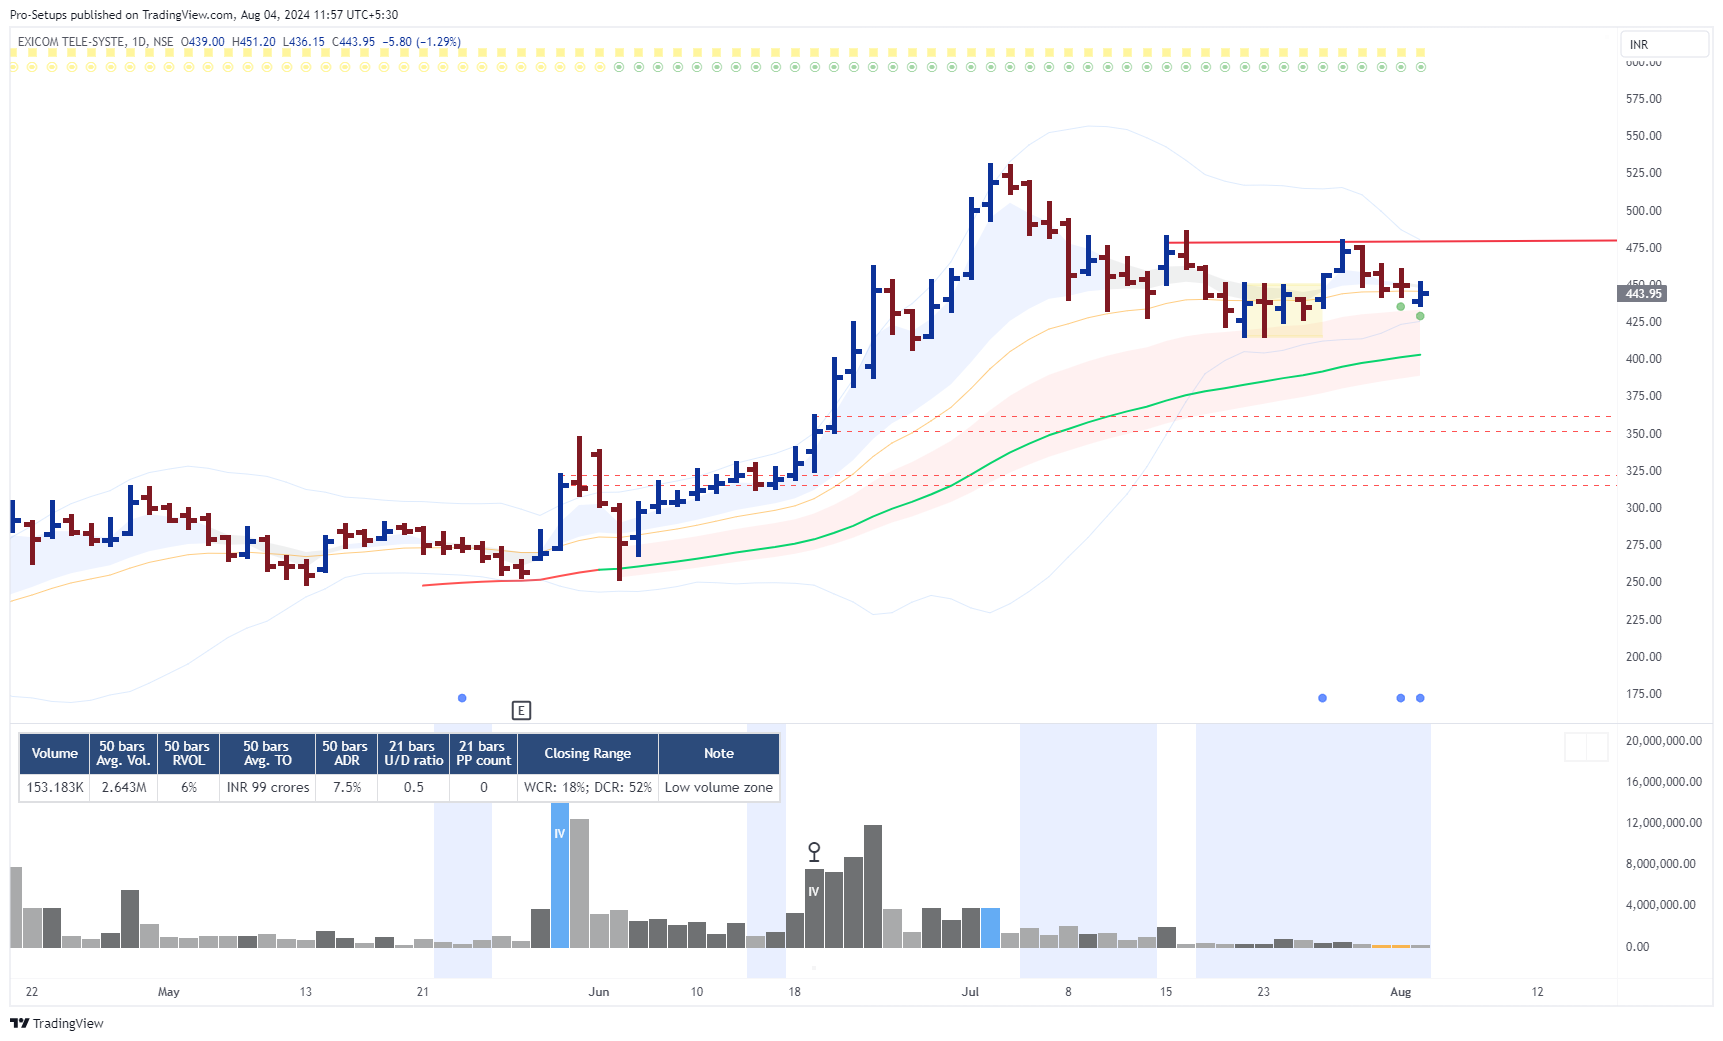
Some charts with TTM Squeeze setups in Recently Listed companies or where June 2024 quarter results have not been announced yet.
Borosil Scientific
Exicom Tele-Systems
Disclaimer: The stocks mentioned in the Newsletter are not to be considered as recommendations. The recipient must do his own diligence and analysis in buying or selling the stocks mentioned in the Newsletter. The recipient is requested to take into consideration all the risk factors including their financial condition, suitability to risk return profile and the like and take professional advice before investing. Investments in securities market are subject to market risks, and recipients are requested to read all the related documents carefully before investing. Derivatives (i.e. Futures & Options) are sophisticated investment device and its trading involves substantial risk & leverage and is not appropriate for all investors. The investor is requested to take into consideration all the risk factors before actually trading in derivative contracts.