
Part I - Valuation's Dynamic Duo: Why RoE and Growth Rates Matter
In this first part, we explore how Return on Equity and Growth rates work together to reveal a stock's true potential - and why the popular PEG ratio often falls short.

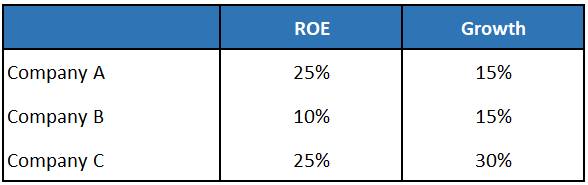
Let’s begin with a simple thought experiment. Take a look at these three companies:
Would you rather own:
(i) Company A, that makes makes 25% return on equity, growing at 15% every year; or
(ii) Company B, that makes 10% return on equity, growing at same level as A?
Most rational business owners would prefer Company A, because higher returns on equity create more value over time.
Now take the idea one step further. Would you rather own:
(i) Company A, that makes 25% return on equity, growing at 15% every year; or
(ii) Company C, that makes same return on equity (25%) as Company A, but growing by 30% every year.
In that case, Company C which is the faster-growing business deserves the edge, and a better valuation multiple too.
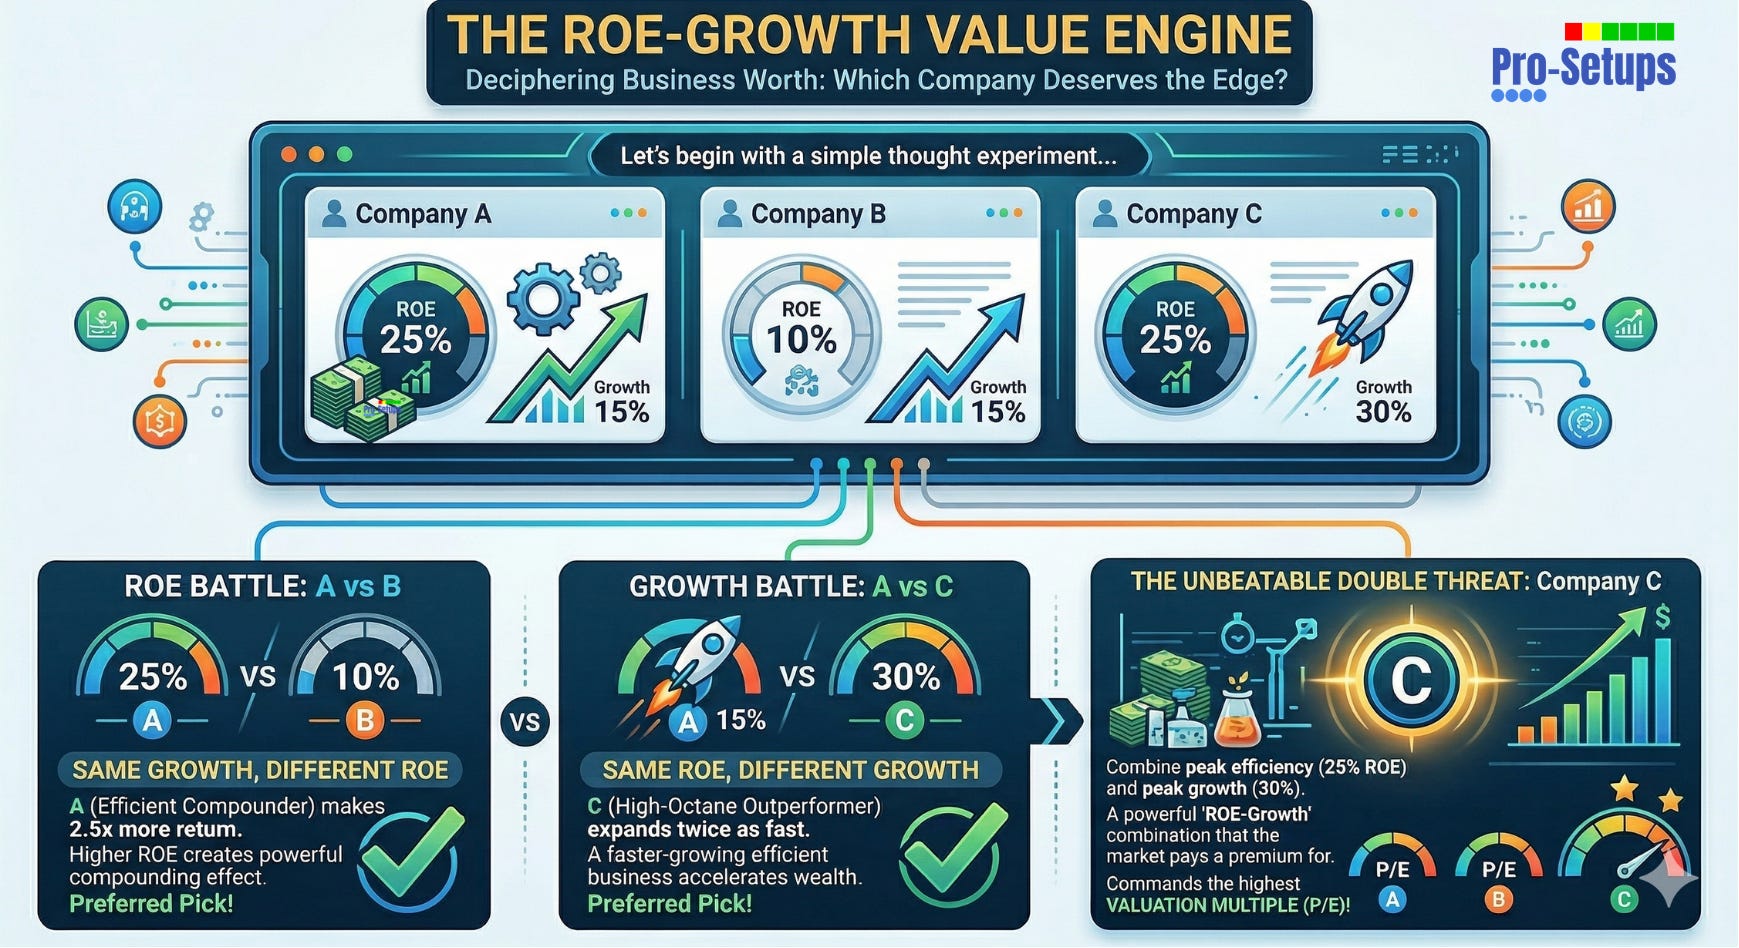
That is the core message of this framework: Companies with higher Return on Equity and stronger growth rates usually deserve higher (not insane) valuation multiples.
Why ROE and Growth matter
Investors often use ratios such as P/Sales, P/E, P/B, EV/EBITDA, or even PEG to judge whether a stock is expensive or cheap. But these metrics, when viewed in isolation, can be misleading because they do not fully capture the quality of the business behind the valuation.
RoE tells us how efficiently a company uses shareholder capital to generate profits.
Growth tells us whether the business is expanding its market opportunity and compounding that into larger earnings over time.
When both are strong, the market often rewards the company with a premium valuation and that can get super performance in stock returns for the investors.
While quantitative metrics like ROE and Growth Rate gives a fair idea of the valuation of a specific stock, one also needs to consider a host of other qualitative metrics such as, but not limited to, company size, relative competitive positioning, management quality, Industry cycles stages etc., before identifying a stock as a potential investment candidate.
RoE and Valuation
Return on Equity is one of the clearest indicators of business quality. High RoE reflects efficient capital use, which is why such companies often command premium valuations. This is also why firms in the same industry trade at different P/E or P/B multiples. However, RoE alone isn’t enough - without sustained growth, even a high-RoE business may not justify a rich valuation.
Growth completes the picture
Growth is the second half of valuation. When returns on capital are similar, the faster-growing company typically deserves a higher multiple due to stronger future earnings potential. This is why growth businesses often appear expensive - investors are paying for what earnings can become, not just what they are today.
As Peter Lynch notes in One Up on Wall Street, the real opportunity lies in companies that combine strong profitability with sustainable growth.
Price/Earnings-to-Growth (PEG) Ratio
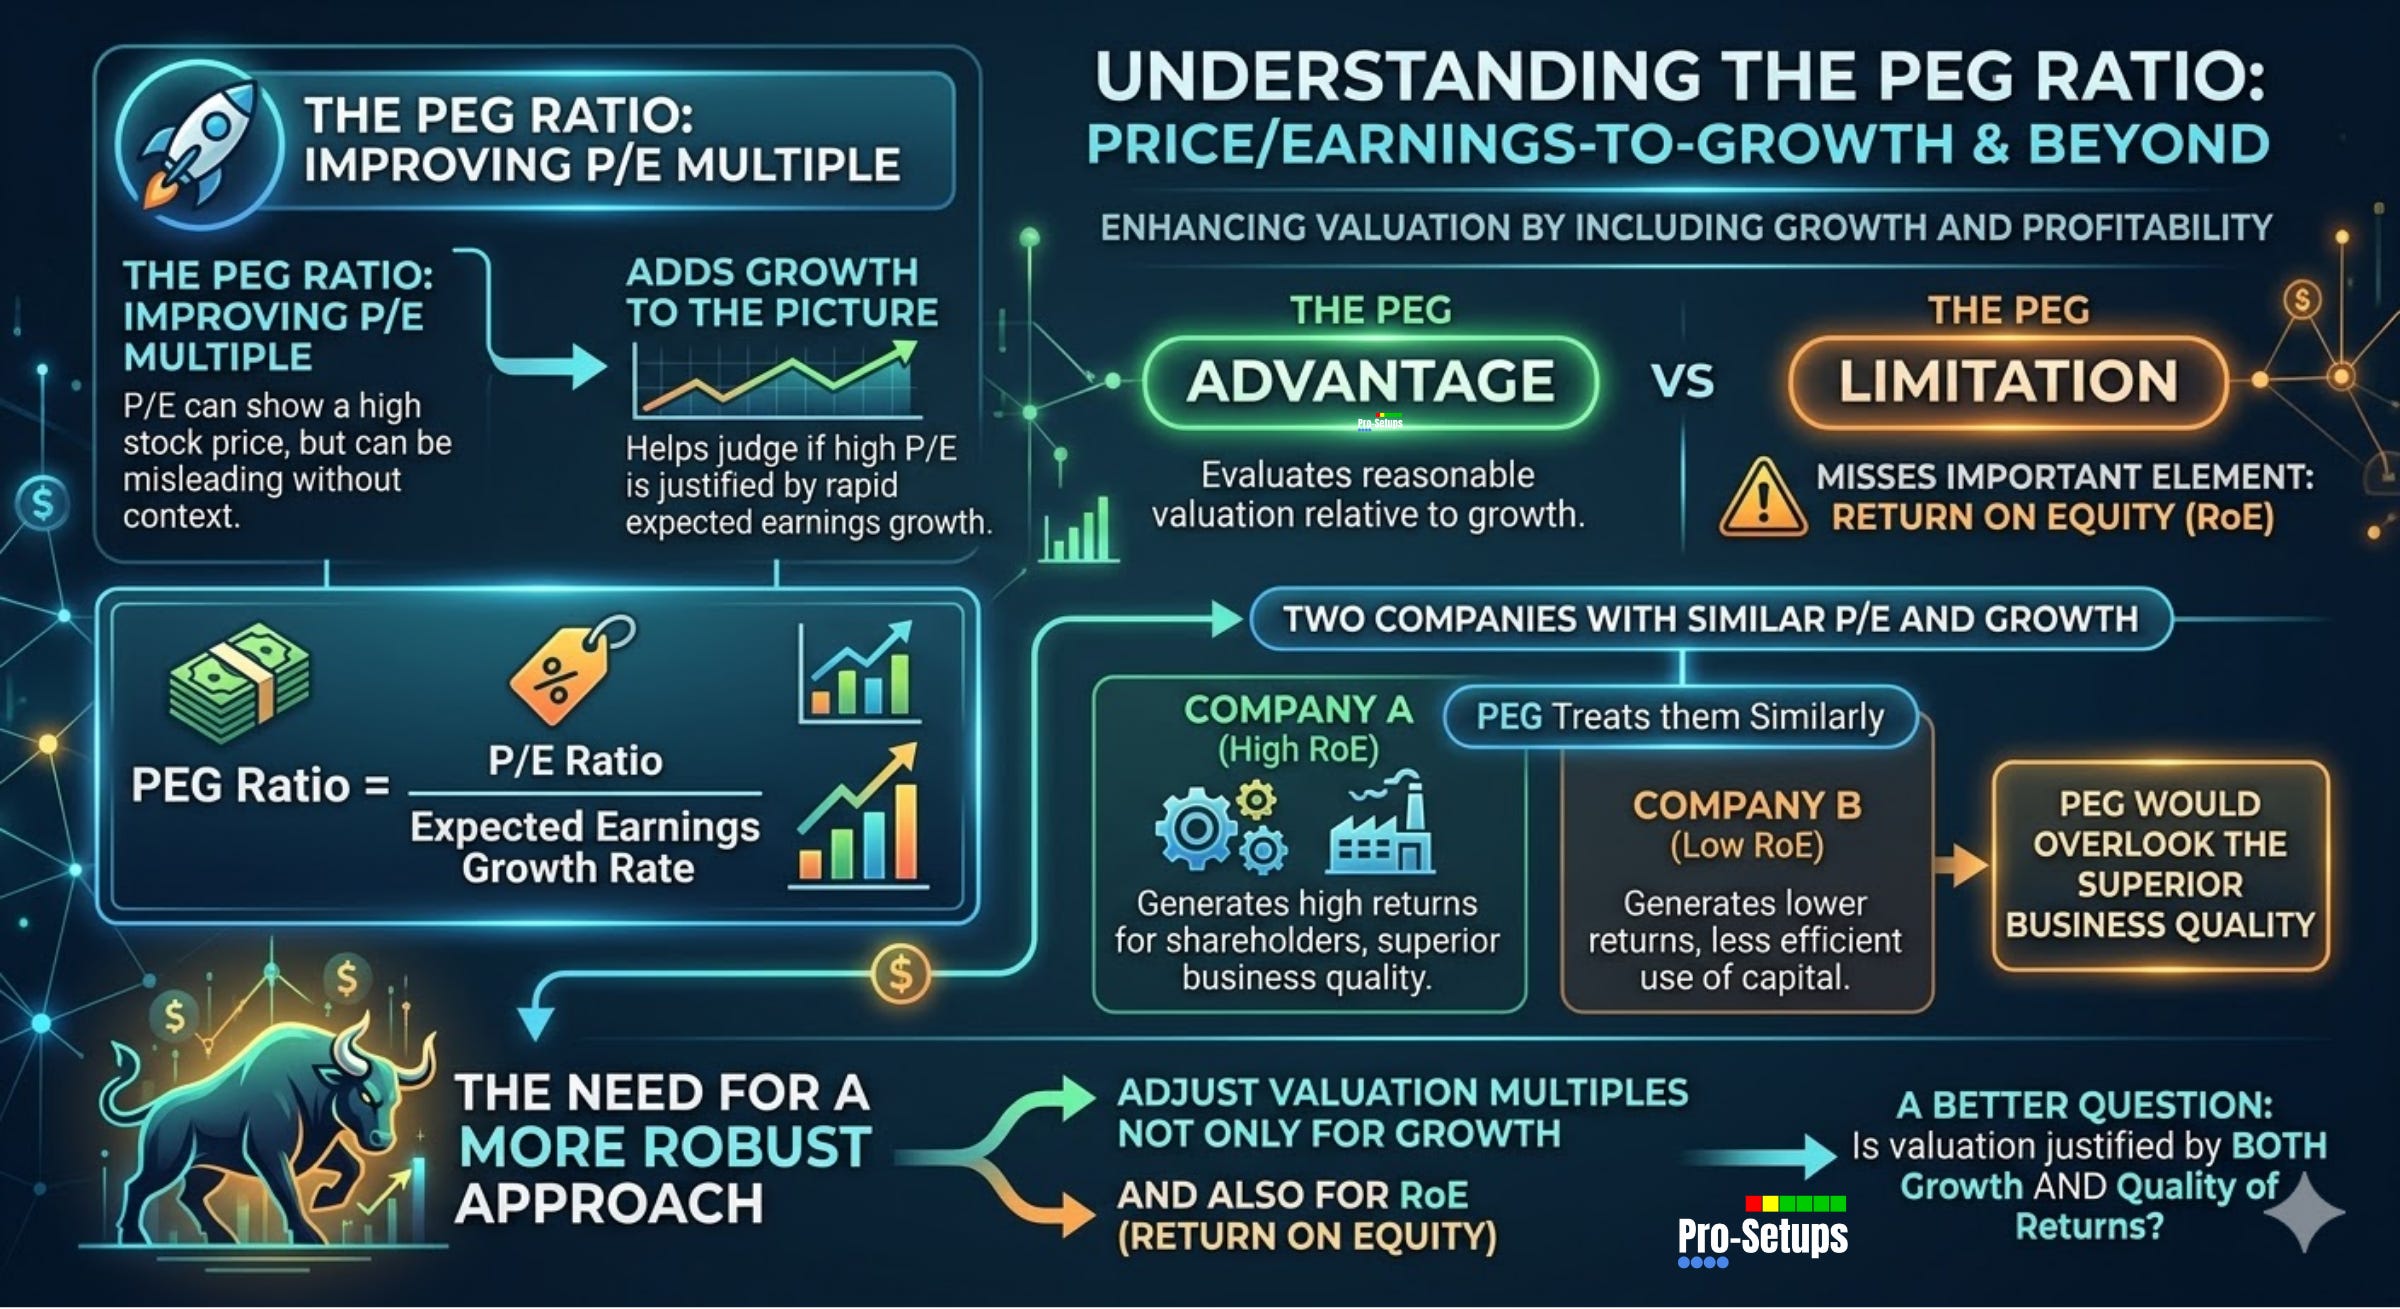
Before building a broader valuation framework, it is useful to understand one of the market’s most popular valuation tools: the PEG ratio. The PEG ratio, or Price/Earnings-to-Growth ratio, improves upon the traditional P/E multiple by bringing growth into the picture.
PEG Ratio = P/E Ratio divided by expected earnings growth rate
The PEG ratio is particularly useful for comparing companies within the same industry but with different growth rates, allowing investors to assess relative value more effectively than with the P/E ratio alone. In general, a PEG below 1 may suggest undervaluation, while a PEG above 1 may suggest overvaluation.
However, PEG ratio misses the important element of Return on Equity. Two companies may have similar P/E multiples and similar growth rates, but if one generates much higher RoE, it is clearly the superior business. PEG would treat them similarly, even though their business quality is not the same.
A more practical framework is to adjust valuation multiples not only for growth, but also for RoE. In other words, instead of asking whether P/E is justified by growth alone, the better question is whether valuation is justified by both growth and quality of returns.
Refining the Inputs: Why We Use Sales Growth and Average RoE
To make this framework truly robust, we apply two critical adjustments:
Prioritizing Sales Growth over Earnings:
The traditional PEG formula uses Expected Earnings Growth Rate. Future earnings growth projections are often speculative, analyst-dependent, or influenced by management’s overly optimistic guidance. Using actual historical sales growth provides a more objective, verifiable foundation. So we assign a higher weightage to the most recent quarter and lower to the previous quarter.
Further, Sales growth rate is often a more reliable metric than earnings growth rate for assessing a company’s market traction, scalability, and operational efficiency. Sales growth directly measures a company’s ability to increase revenue from its core operations, unlike earnings, which factor in expenses and accounting adjustments such as depreciation or one-time adjustments. A 20% sales growth rate signals rising customer adoption, even if earnings are temporarily depressed due to reinvestment.
Averaging RoE for Stability:
Rather than looking at just the last year’s RoE, we use average RoE of the last few years. This captures a company’s ability to generate returns across different market conditions and operational cycles, smoothing out one-time distortions.
Case Study
Let’s explore the relationship between valuation multiples (P/E) and fundamental quality (ROE and Growth) across six major Asset Management Companies listed in India.
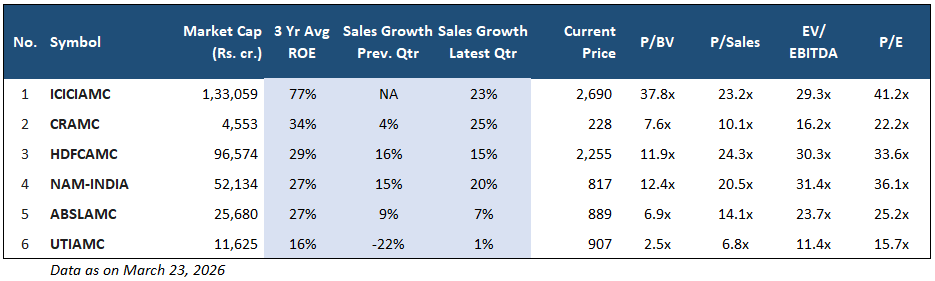
At first glance, UTIAMC appears to be the cheapest stock in the sector with a P/E of 15.7x, while ICICIAMC looks expensive at 41.2x. However, a quick look into the fundamentals reveals why the market has assigned these specific price tags.
a) The High-Performance Leader: ICICIAMC
ICICIAMC commands the highest valuation in the peer group for a clear reason: Capital Efficiency with Growth.
Massive ROE: At 77%, its return on equity is nearly triple that of most peers.
Resilient Growth: It maintains a robust sales growth of 23%.
The Verdict: The market is willing to pay a premium (41.2x P/E) because the company generates world-class returns on every rupee of capital invested.
b) The Value Trap: UTIAMC
Conversely, UTIAMC’s low P/E is not a discount - it is a reflection of underperformance.
Low Efficiency: A 16% ROE is the lowest in the group, suggesting it struggles to generate significant profit from its equity base, compared to its peers.
Growth Struggles: With a growth of -22% and only 1% in last two quarters, it is lagging far behind the industry average.
The Verdict: A low multiple of 15.7x is the market’s way of discounting a business with stagnant growth and low capital efficiency.
c) The Middle Ground: CRAMC, HDFCAMC, NAM-INDIA and ABSLAMC
The other four companies offer a somewhat balanced profile as far as their ROE profile is concerned. While their ROEs are relatively consistent (27%-34%), their paths diverge once growth is factored in.
With its robust 25% growth in the latest quarter, CRAMC’s valuation becomes attractive at 22x PE multiple.
HDFCAMC and NAM-INDIA offer steady, predictable performance with similar growth rates and valuation.
However ABSLAMC’s low growth rates gets penalized to result into a lower P/E multiple (25.2x) because capital efficiency without meaningful growth is not acceptable to investors seeking premium returns.
Coming Next in Part 2: The Pro-Setups Advantage
High returns and fast growth are the engines of valuation. To find a true winner, you have to look at how much a company earns on its capital (ROE) and how fast it is moving (Growth).
In Part 2, we will show you how Pro-Setups does this hard work for you. We make it easy for our members to see which stocks are attractively priced and which ones are overpriced. Stay tuned to see how we turn all what you read today into actionable insights.