
Chart of the Week - NSE: QPOWER
QPOWER surged over 38% in two weeks. The conditions that appeared just before the move and how you too can spot such similar setups!!


Name: Quality Power Electrical Equipment Limited
Listing: February 2025
Sector: Power
Industry: Power Infra, Trans. Equipment & Services
Business Overview: Incorporated in 2001, Quality Power Electrical Equipment Limited (NSE: QPOWER) is engaged in the business of energy transition equipment and power technologies. The company provides high-voltage electrical equipment and solutions for grid connectivity and energy transition, specializing in power products across generation, transmission, distribution, and automation sectors. The company manufactures critical high-voltage equipment for High Voltage Direct Current (HVDC) and Flexible AC Transmission Systems (FACTS) networks. These equipment and networks form key components for energy transition from renewable sources to traditional power grids.
Recent Gains: In the last two weeks, the stock has moved up by around 38% (from ₹871.65 on 2nd April to ₹1,206.05 on 17th April).
In this post, we break down the conditions that were present before this move started, and how similar opportunities can be identified for a portfolio.
Here is the recent chart of the company, and highlighted is the move that we are studying.
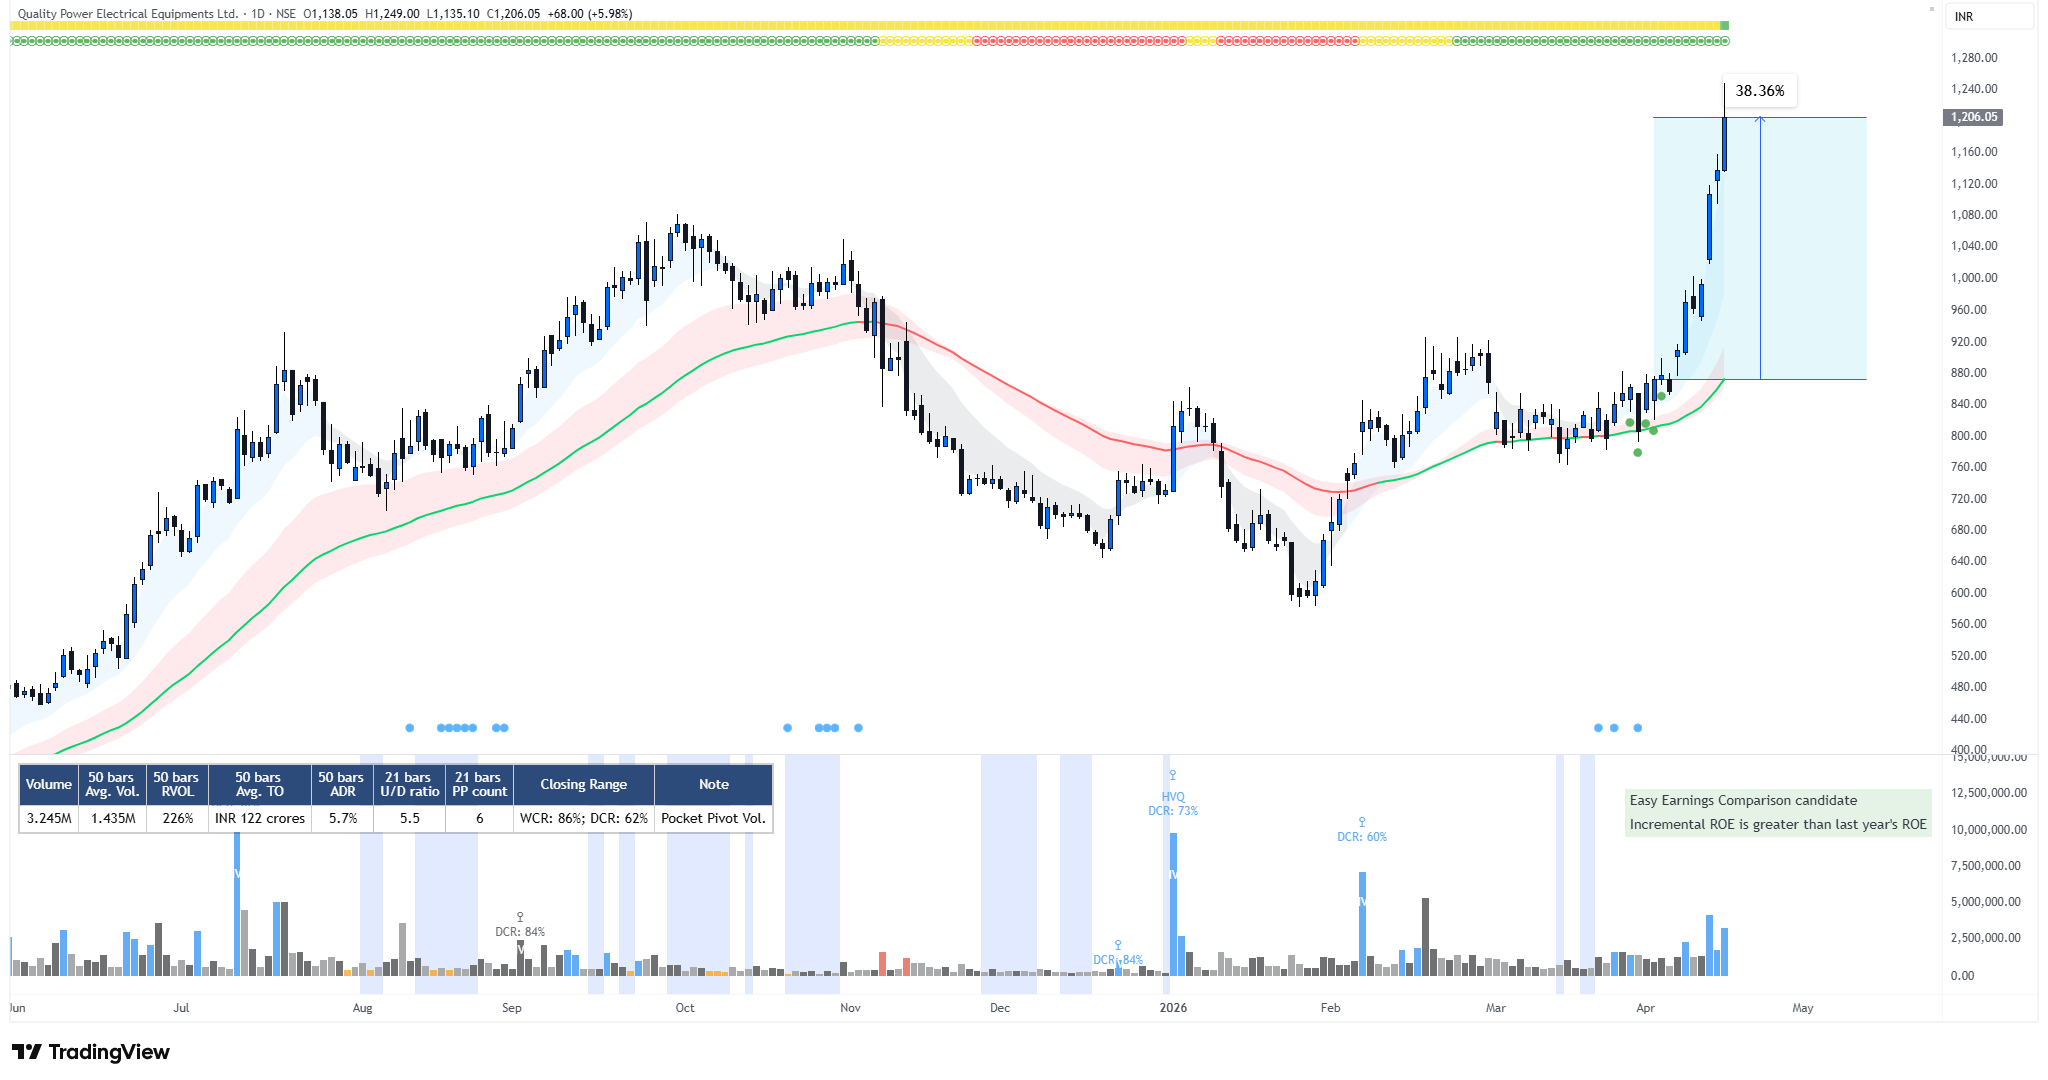
We will focus on the setup that existed just before the breakout, especially the few days leading up to 2nd April.
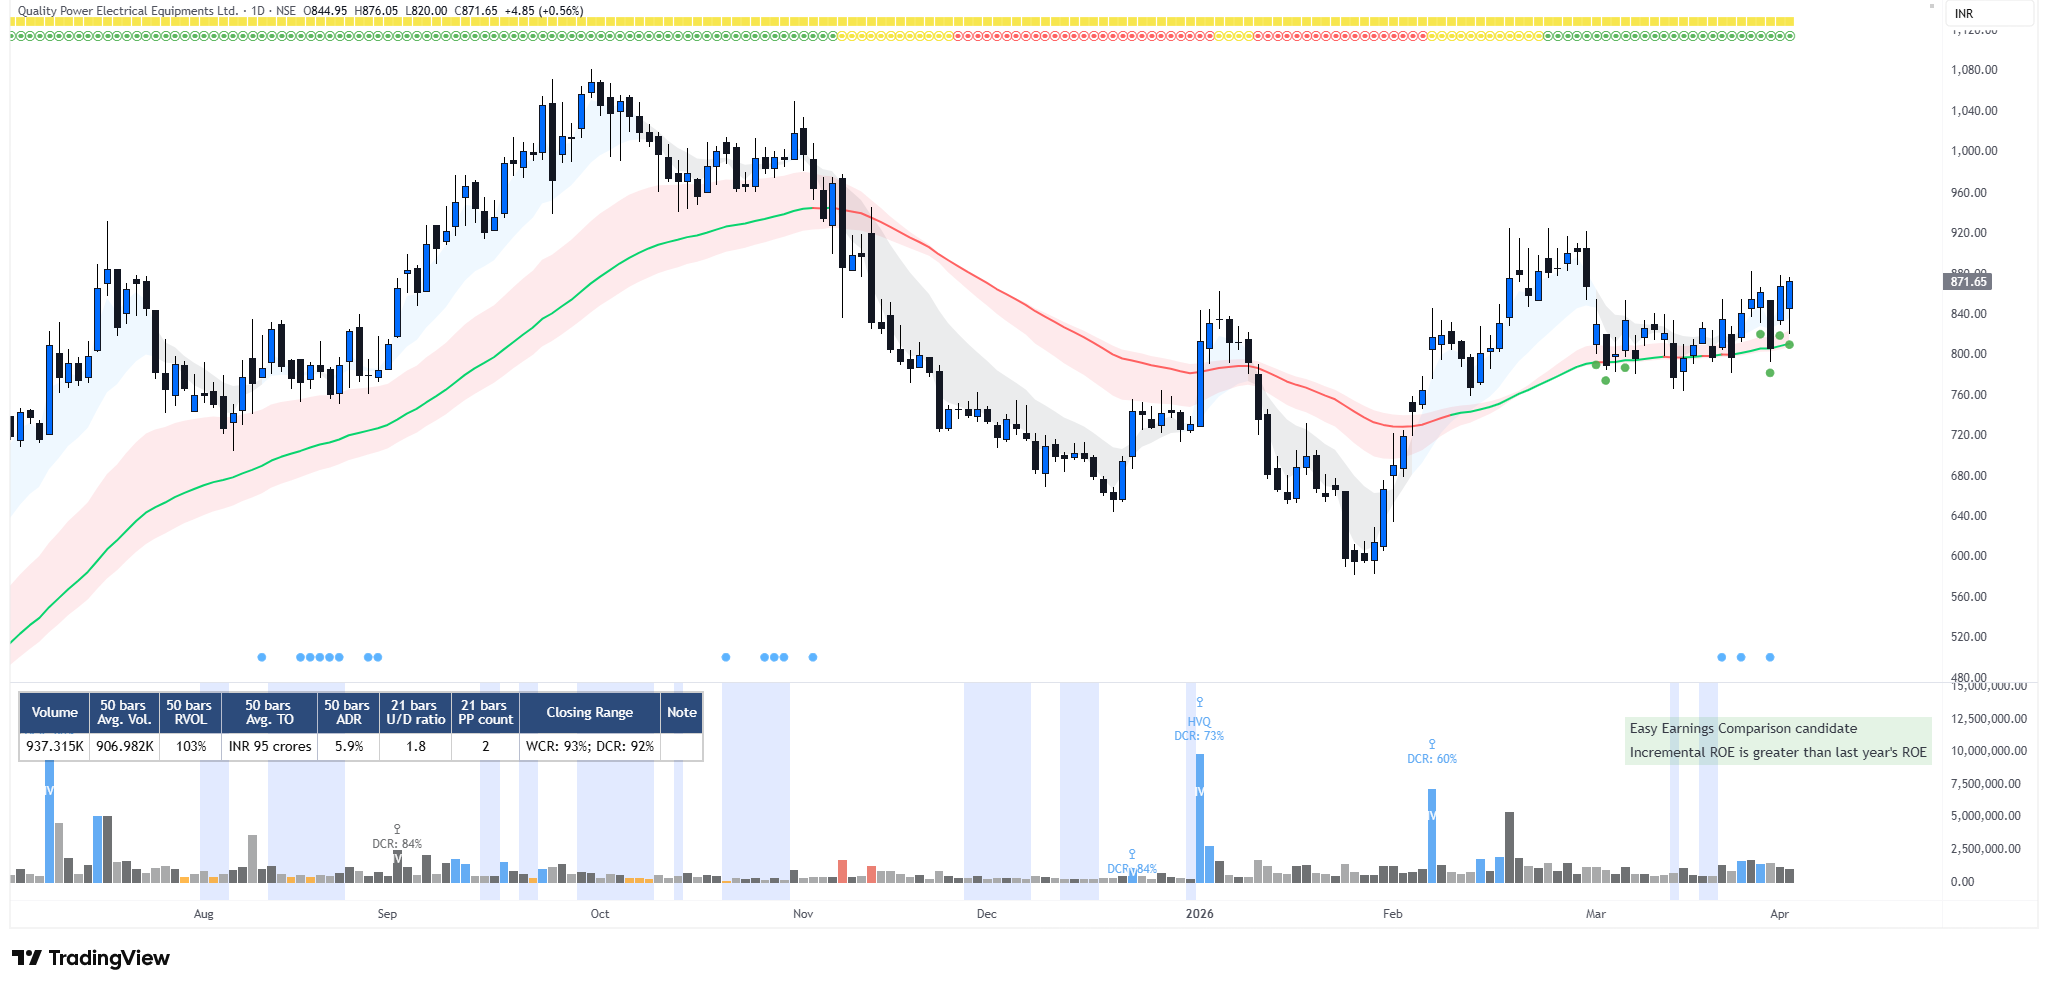
Prior Upmove & Base Formation
The stock had already shown strong strength earlier, rallying nearly 300% between April 2025 and September 2025.
After that, it entered a consolidation phase from October 2025, before eventually moving to new all-time highs this week.
During this consolidation, the 50EMA had turned red but recently shifted back to green. Trading on the long side only when the 50EMA is green is a simple but effective way to improve trade quality.
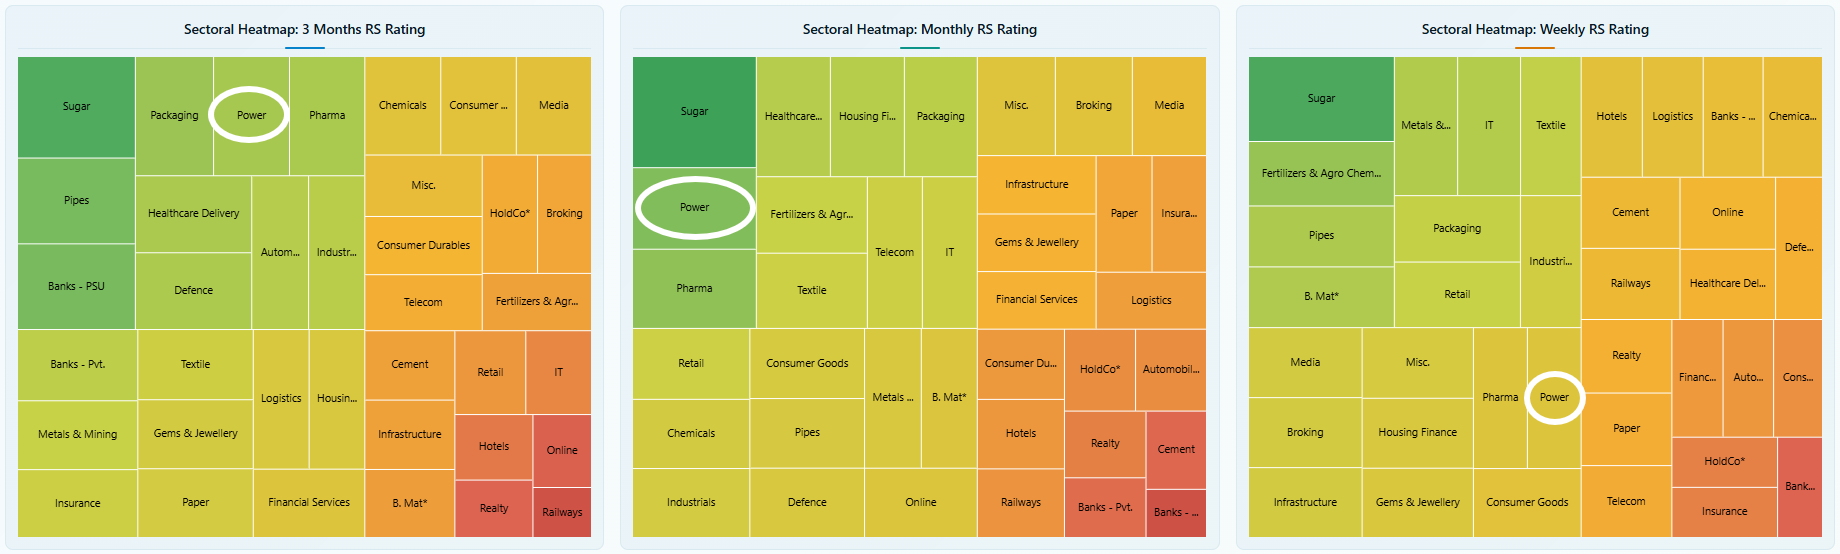
Sector Strength
As of 2nd April, the Power sector was showing strong performance across both 3-month and monthly timeframes, ranking among the top sectors.
3-Month RS: 60
Monthly RS: 66
While the sector was already strong, QPOWER was relatively quiet - a common sign of stocks preparing for a move.
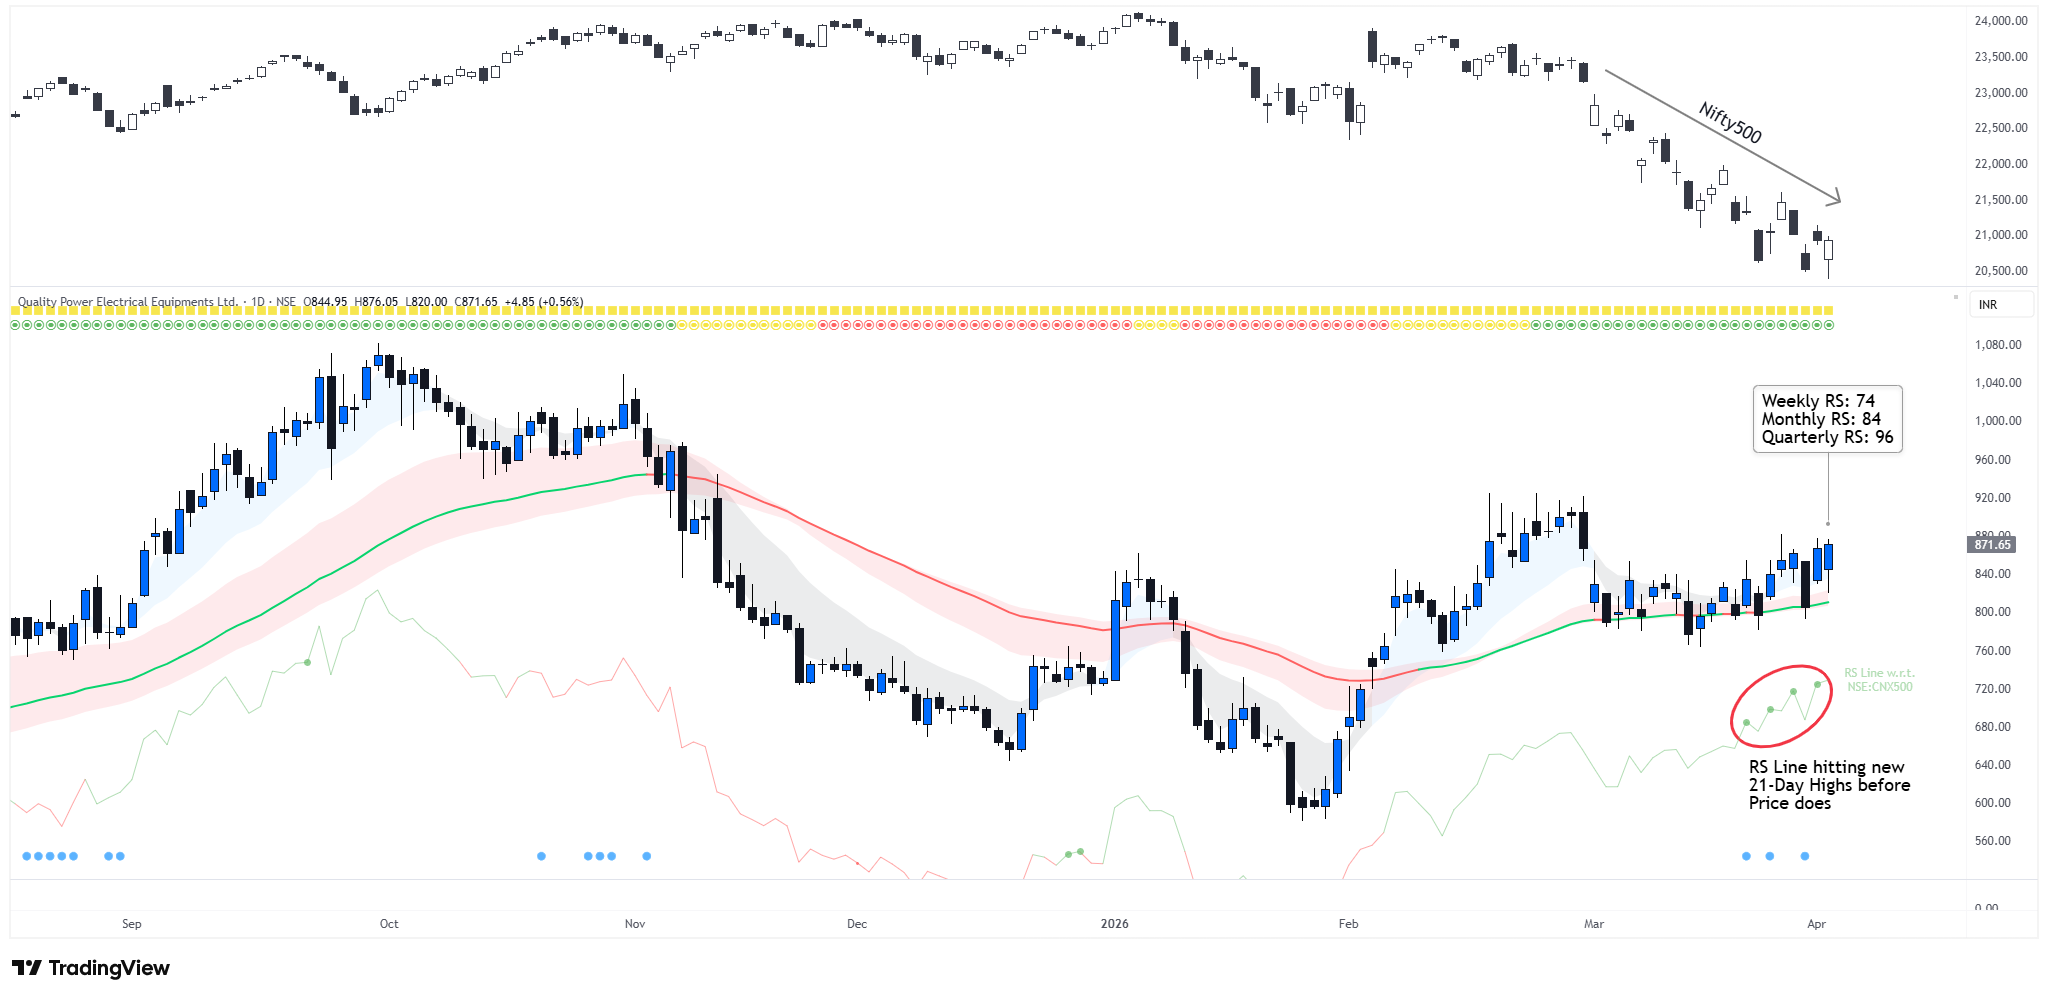
Relative Strength against other stocks
On 2nd April, QPOWER showed strong relative strength across multiple timeframes, even as the broader market was weak:
1 Week RS: 74
1 Month RS: 84
Quarterly RS: 96
A Quarterly RS of 96 means that the stock outperformed 96% of the stocks in our trading universe, while only 4% outperformed it.
Relative Strength vs Nifty 500
In March, the broader market declined by more than 10%, but QPOWER remained largely flat - a strong sign of resilience.
At the same time, its RS line started making new 21-day highs even before price did. This early strength often signals potential leaders.
This is where relative strength becomes most useful. When the market is weak, instead of sitting idle, the focus should be on stocks that are holding up well. These are often the ones that lead the next upmove.
Technical Factors
Green trend on Daily timeframe (Weekly trend was Yellow because of limited trading history of the stock necessary for its calculation).
Rising 50EMA. A simple way to manage risk is to only consider long positions when the 50EMA is rising.
TTM Squeeze signaled that pressure was building up, and once the stock started moving, that built-up energy got released. While not a critical factor, it added extra strength to the setup.
Fundamental Factors
Fundamental Score: 88
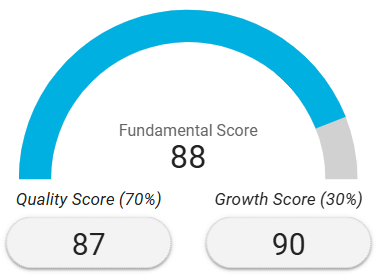
The Fundamental Score is our proprietary rating, built on the company’s quality and its recent growth. A high score indicates that the company meets the key financial metrics typically used for fundamental evaluation.
Valuation Grade: A+
Pro-Setups proprietary valuation grading rates stocks from A+ to E, where A+ represents the most attractive valuation and E signals the least.
Company qualified for Easy Earnings Comparison filter. This is one of the most important fundamental filters. Companies that satisfy this criteria can report blockbuster earnings in the upcoming quarterly results.

What Happened Next
Following the easing of tensions between the United States and Iran after the ceasefire around 7-8 April, global sentiment improved and markets started to recover. As the broader market picked up post 6th April, QPOWER responded strongly, rallying over 38% in a short span. This move clearly showed how all the factors in the setup - sector strength, relative strength, fundamentals, and technical structure came together and played out effectively once the market environment turned supportive.
How can Pro-Setups Help to Identify such Setups
Identifying such high-quality setups manually can be time-consuming and often inconsistent. This is where the Pro-Setups Dashboard makes the process much simpler and more structured.
All the key factors we discussed - whether it is sector strength (Sectoral RS), stock-specific Relative Strength, or technical signals like Green Trend, Rising 50EMA, RS Line, and TTM Squeeze, are readily available within the dashboard. On top of that, important fundamental filters such as Easy Earnings Comparison and Valuation Grade are also built in.
You can bring all these conditions together in one place and quickly narrow down stocks that meet your criteria. This helps you focus only on those names that are quietly building strength, even before the move becomes obvious.
If you are serious about finding strong setups early, the Pro-Setups Dashboard can significantly improve both your speed and decision-making. Use the link below to subscribe to Pro-Setups today!
Which stock, in your view, deserves the title of Chart of the Week? Let’s discuss your picks, ideas, and reasoning in the Pro-Setups Discussion Group and learn together!