
Part II - Valuation's Dynamic Duo: The Pro-Setups Advantage
Learn how to simplify valuation comparisons using Bubble charts and our Valuation Grading system. This framework ensures you get the most growth and efficiency for every rupee invested.
Beyond the PEG Ratio: A Holistic Framework for Valuation
In the first part of our valuation series, we explored why Growth and Return on Equity (RoE) are crucial for decoding valuation, along with the limitations of the PEG ratio. If you missed the first part, you can catch up in the below mentioned link.
Part I - Valuation's Dynamic Duo: Why RoE and Growth Rates Matter

Let’s begin with a simple thought experiment. Take a look at these three companies:
This second part of our valuation series moves beyond the basics to introduce a more robust way of blending growth and RoE to spot attractively priced companies.
The Pro-Setups Approach: Beyond the PEG Ratio
At Pro-Setups, we address the limitations of PEG Ratio by adjusting traditional valuation multiples using both a company’s 3 years Average RoE and its weighted average sales growth.
We call these Adjusted Valuation Multiples. By dividing the traditional valuation multiples by a combination of a company’s average RoE and weighted sales growth, we create a more accurate picture of ‘fair value’.
In simple terms, the adjusted valuation multiples are:
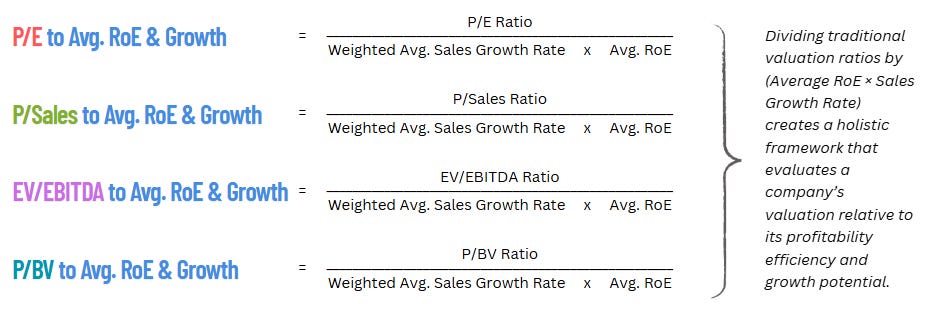
The Rule of Thumb: The lower the adjusted ratio, the more reasonable the valuation is relative to the company’s peer group.
Why use Adjusted Multiples?
These ratios combine Valuation (market sentiment) with Sales Growth (operational traction) and RoE (profitability efficiency).
These ratios could help identify undervalued firms with strong sales momentum and efficient capital utilization.
Integrates profitability (ROE) and growth (sales) to avoid overpaying for companies with high multiples but weak fundamentals.
Averaging RoE smooths one-time distortions, while sales growth is harder to manipulate than earnings.
What High vs. Low Adjusted Valuation Ratios Reveal
A high adjusted valuation ratio indicate that the current valuation is not justifiable either because of:
Unreasonable Market Sentiment: Elevated valuation multiples not supported by fundamentals or growth.
Weak Profitability: Low RoE reduces earnings efficiency, making high valuation unsustainable.
Slower growth rates fail to justify premium valuations, even in high-margin sectors.
A low adjusted valuation ratio indicates that the current valuation is attractive and justifiable because of:
Rational or Undervalued Market Sentiment: Valuation multiples are well-supported or even surpassed by the company’s underlying fundamentals and growth trajectory.
Strong Profitability: A high Average RoE enhances earnings efficiency, making the current valuation sustainable and potentially undervalued.
Robust Growth: Strong sales growth rates fully justify current premiums and signal a company with significant market traction.
Case Study: Asset Management Companies (AMC)
Let’s go back to the case study illustrated in Part I of this valuation series. We noticed how UTIAMC at a P/E of 15.7x appeared to be the cheapest stock, but was actually a value trap. On the other hand, ICICIAMC at a P/E of 41.2x, looked expensive but deserved to get high premium from the market.
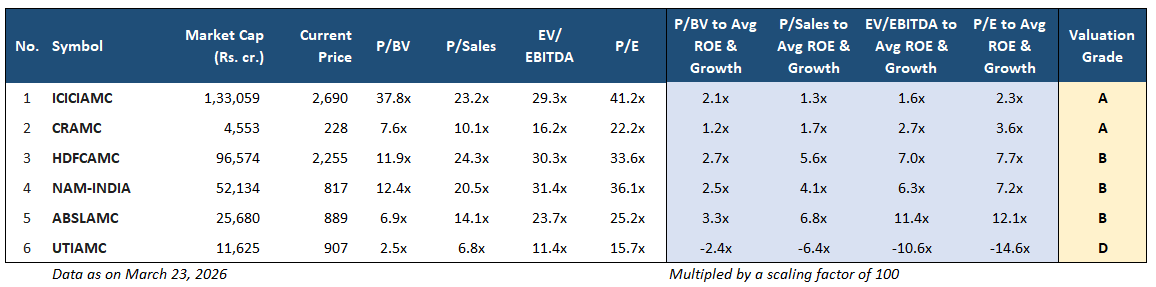
By dividing traditional valuation multiples by a combination of Average RoE and Growth, we get a clearer picture of which companies offer the best value for their performance. See the table below:
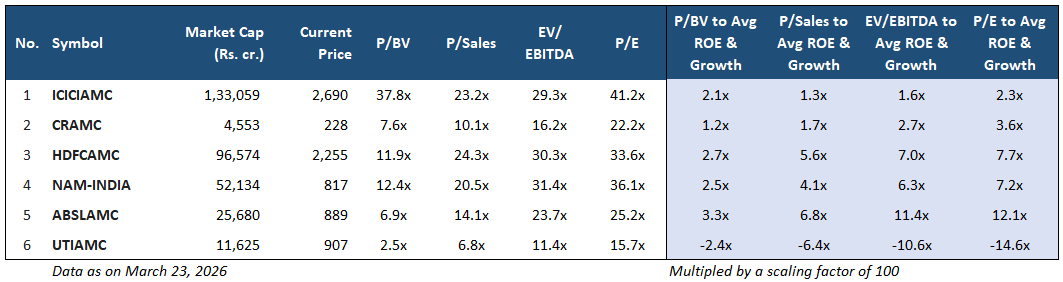
ICICIAMC’s adjusted P/E to Avg RoE & Growth is only 2.3x, which is the lowest positive ratio among all its peers. It earns its premium by delivering superior performance, making it deserving candidate for a higher valuation tag.
On the other hand, UTIAMC’s negative adjusted ratio signals that either the RoE or weighted avg. growth is in negative territory and hence it’s not as good as option to invest compared to its peers, until it starts showing positive performance.
CRAMC: Offers the next best value after ICICIAMC.
HDFCAMC and NAM-INDIA: Are solid but significantly more expensive relative to their performance than the leaders.
ABSLAMC: Though its raw P/E multiple is lower than HDFC, its high adjusted ratio of 12.1x shows you are paying a much higher price for every unit of growth and efficiency you receive.
Same interpretation can be drawn using other adjusted valuation multiples too.
A stock like ICICIAMC may carry a high premium, but its lower adjusted ratios relative to its peer group prove it is actually the more attractive investment. Ultimately, the goal is to find companies where you get the most growth and efficiency for every rupee invested.
Visualizing Value: The Bubble Chart
Wondering if this can be visualized for better clarity? Absolutely!
To make this data actionable, the Pro-Setups Dashboard uses bubble charts to plot performance:
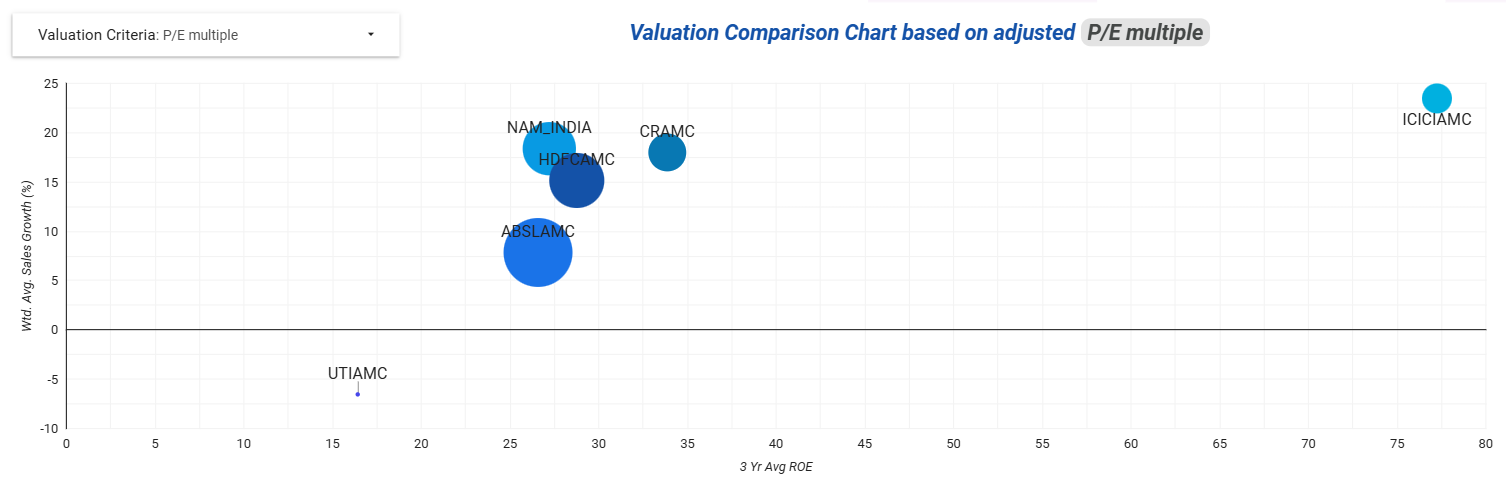
On the y-axis, we have the weighted average sales growth, where companies with higher growth appear at the top.
On the x-axis, we plot the 3-year average Return on Equity, with companies having higher RoE positioned further to the right.
The size of each bubble represents the valuation multiple (like P/E to average RoE & growth). A smaller bubble indicates a better, more attractive valuation.
Pro-Tip: The most attractively valued company will have the smallest bubble and be located in the extreme top-right corner of the chart.
In the chart above, ICICIAMC is positioned on the top-right of the chart and has smallest bubble compared to its peers. This suggests that it is actually cheapest in terms of valuation compared to others, when adjusted for growth and RoE.
CRAMC, NAM-INDIA, HDFCAMC and ABSLAMC are hanging out in the middle, but CRAMC has the smallest bubble size among these four, and hence offers higher value too. ABSLAMC, on the other hand, has biggest bubble size and hence it is expensive in adjusted terms.
UTIAMC growth rate is negative, and hence its bubble size is irrelevant and offers lowest value among the entire peer group.
The above bubble chart can be seen for other adjusted valuation multiples too and is available in the Peer Comparison page under Financial Insights in the Pro-Setups Dashboard.
Simplifying Discovery: Valuation Grading
Visualizing data is great, but filtering through hundreds of stocks or multiple sectors requires speed. We have simplified this into a Valuation Grade (A+ to E) based on how a stock stacks up against its sector peers.
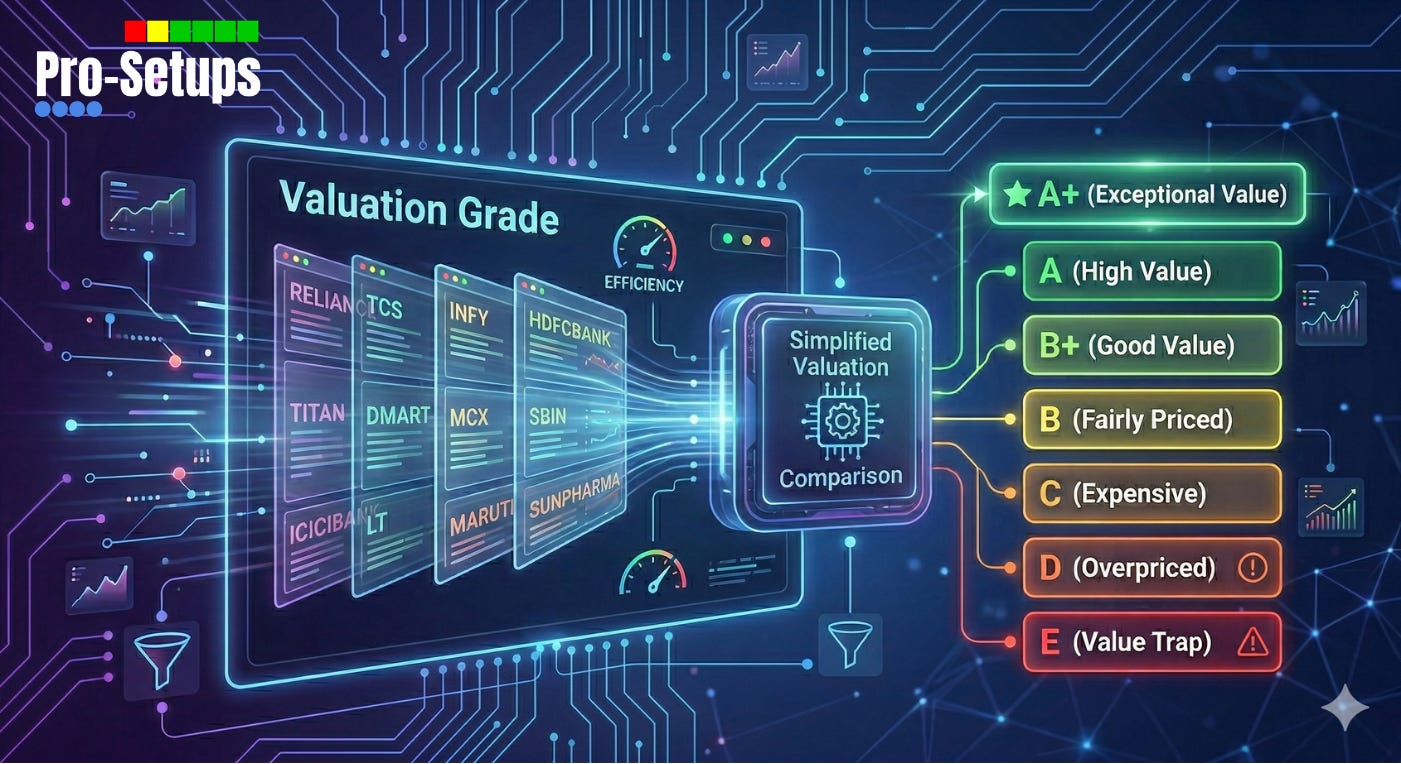
We benchmark every stock against its peers, assigning scores based on their specific adjusted valuation multiples.
These marks are then distilled into a final grade ranging from A+ to E, where A+ represents the most attractive valuation and E signals the least.
A+: Exceptional Value
A: High Value
B+: Good Value
B: Fairly Priced
C: Expensive
D: Overpriced
E: Value Trap
Lets look at the valuation grades of the Asset Management Companies illustrated above.
The Efficiency Leaders (Grade A)
ICICIAMC & CRAMC: Both companies secure an ‘A’ grade. These companies offer the most compelling value proposition because they provide the best performance relative to their growth rates and operational efficiency.
The Middle Ground (Grade B)
HDFCAMC, NAM-INDIA & ABSLAMC: These industry mainstays fall into the ‘B’ grade category. While these are fundamentally solid companies, their adjusted ratios reveal they are more expensive for every unit of growth achieved when compared to the top-tier leaders.
The Underperformers (Grade D/E)
UTIAMC: This stock is assigned a ‘D’ grade primarily due to its negative growth.
It’s important to note the severity of these grades. Had the company reported negative Return on Equity (RoE), it would have dropped to an ‘E’ grade.
You can find these readymade filters on the Pro-Setups Dashboard to identify top-tier value with a single click.
Conclusion
In this valuation series, we have unpacked why traditional valuation metrics like P/E, P/Sales etc. or even PEG ratio fall short, revealing the power of blending average RoE with weighted sales growth for finding attractively valued companies. Adjusted Valuation Multiples - dividing traditional valuation ratios by growth and RoE - expose undervalued gems and value traps, as lower adjusted ratios signal better value relative to peers.
The Pro-Setups Dashboard simplifies valuation comparison by offering bubble charts for instant visual screening of how a company fares within its sector, as far as its growth, RoE and adjusted valuation multiples are concerned. By utilizing Valuation Grades (A+ to E) to benchmark stocks against their peers, investors can filter high-grade opportunities across hundreds of names with a single click.
Arm your trading with this framework via Pro-Setups - spot attractive opportunities efficiently and trade smarter in Indian markets.